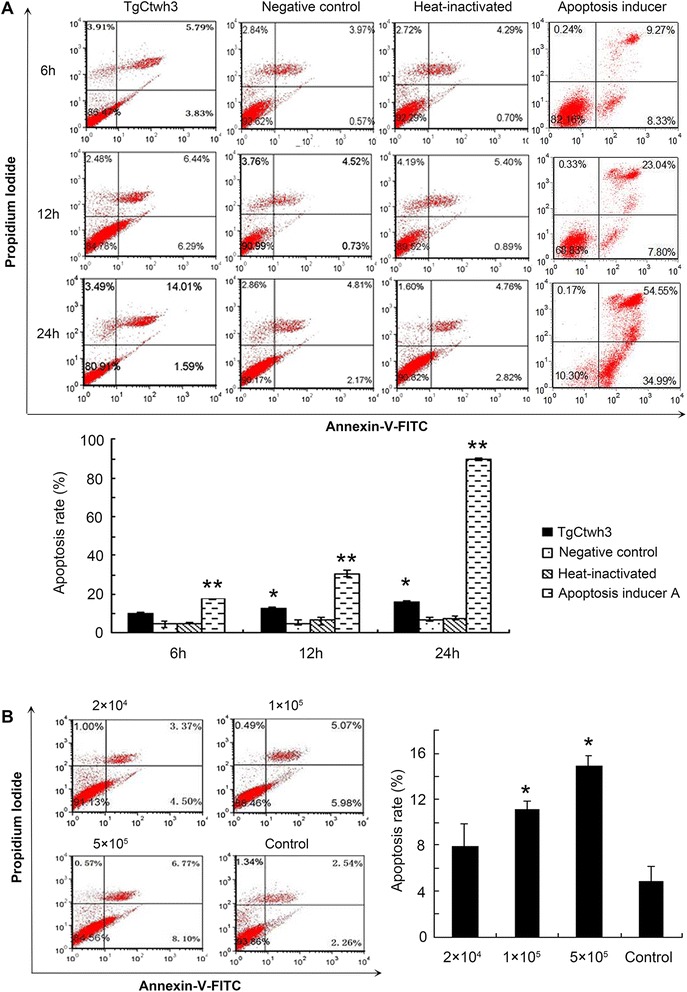
Figure 2.

Apoptosis detected by flow cytometry. (A) The C17.2 cells were co-cultured with 5 × 10⁵ TgCtwh3 tachyzoites, heat-inactivated tachyzoites or Apopida (apoptosis inducer A) for 6 h, 12 h, and 24 h; (B) The C17.2 cells were co-cultured with various doses of TgCtwh3 tachyzoites (2 × 10⁴, 1 × 10⁵ and 5 × 10⁵) for 24 h. The cells were then collected, stained with Annexin V/PI, and analyzed by FCM. The plots are from a representative measurement and the graphics represent the mean and S.D. on three different assays (n = 3). * P < 0.05; ** P < 0.01 vs. Negative controls.
