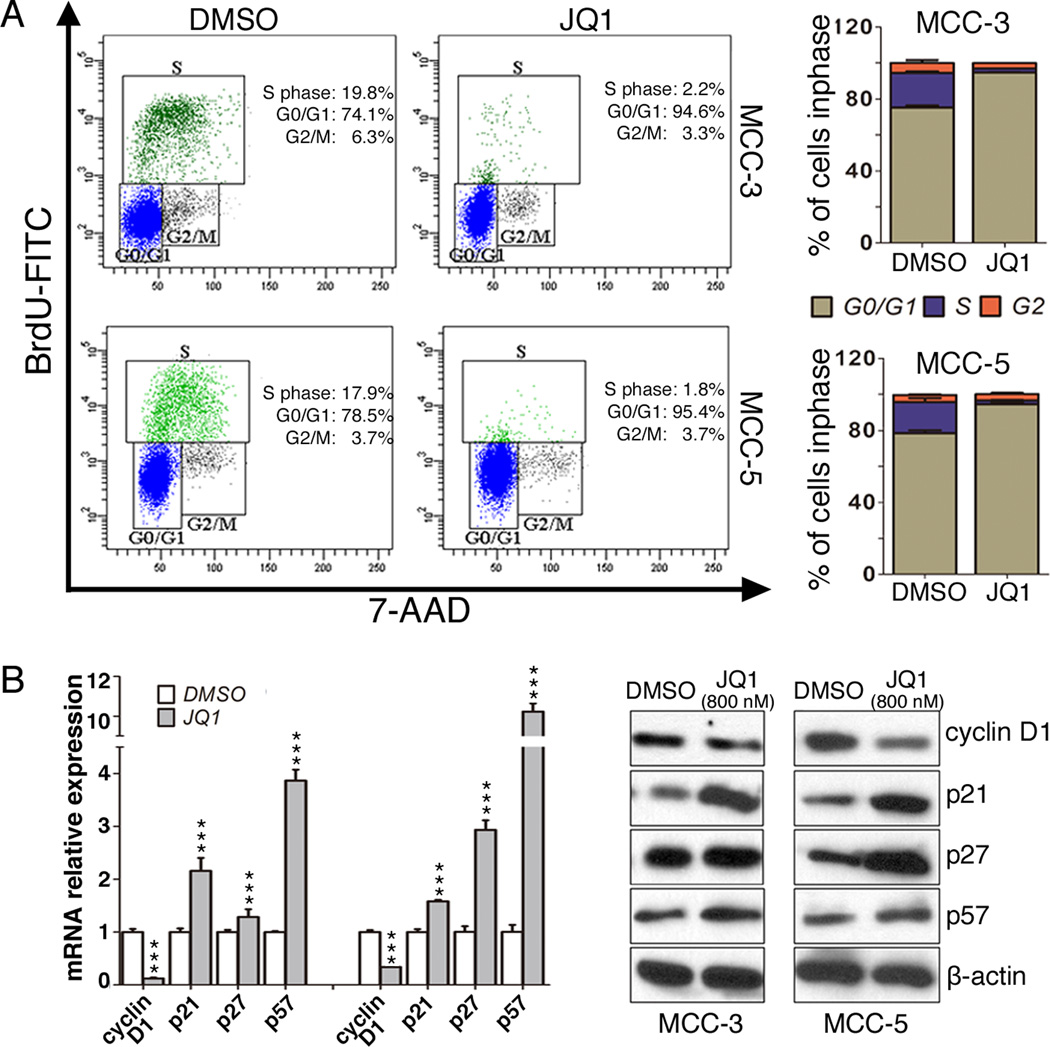
Figure 3. JQ1 induced cell cycle arrest is via upregulation of p21, p27 and p57 in both MCC cell lines.
A. Representative FACS histograms show the distribution of MCC cells in cell cycle after JQ1 treatment. MCC-3 and MCC-5 cells were treated with JQ1 (800nM) for 72 hours and stained with BrdU and 7-AAD followed by flow cytometry analysis (means ± SEM). Bar graphs show the percentage of MCC cells in each cell cycle phase. Data presented as means ± SEM of triple experiments. B. Expressions of cell cycle associated genes in MCC cells (MCC-3 and MCC-5) treated with JQ1 (800nM) for 72 hours by qPCR and immunoblotting. The mRNA expression of target genes was normalized to that of MRPS2 and a value of 1.0 was assigned to the mRNA expression of target genes in the control group (means ± SEM), (***P<0.001 vs control); β-actin was used as a loading control.

