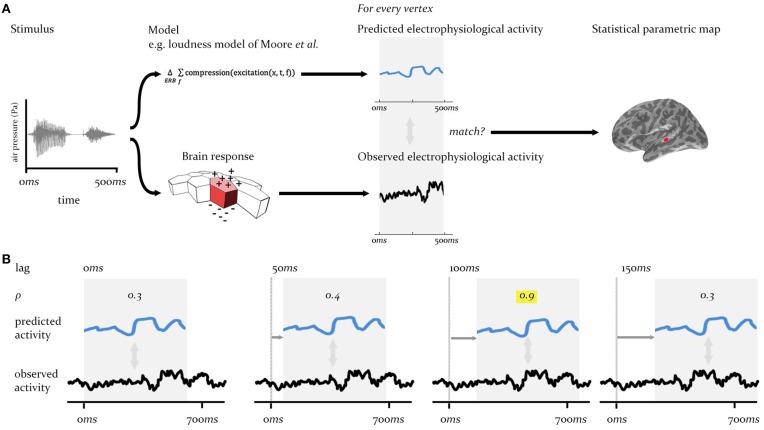
Figure 2.
Technique overview. First (A), the electrophysiological activity of the brain in response to a given stimulus (measured using EMEG) is matched to the pattern of neural activity predicted by the model being evaluated. Predicted and observed activity are tested for similarity (see Figure 3A) and the resulting SPM displays the regions (vertices) where the match is statistically significant. Second (B), this procedure is repeated at different lags (illustrated here from 0 to 150 ms) between the onset of the observed neural activity and the onset of the predicted output. The similarity (Pearson's ρ) will be highest at the correct lag (highlighted). This produces an SPM that changes over time.

