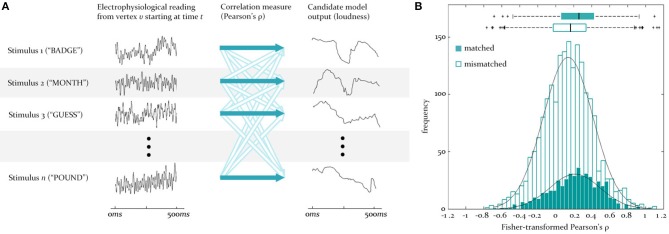
Figure 3.

Testing for similarity between source signals and model outputs. (A) To test for the similarity between the predicted and observed activity at a vertex, the reconstructed EMEG signal at that vertex for each stimulus word (numbered 1 to n) is correlated (dark blue arrows) with the output of some model (here loudness) for the same word. This set of matched correlations is evaluated against a set of mismatch correlations, generated by correlating the same EMEG signals with the predicted output for five randomly selected different words (unfilled arrows). Time is from stimulus onset. (B) Illustration of the underlying matched and mismatched distributions when the instantaneous F0 model is tested at a source in LH auditory cortex at 95 ms, together with the means and quartiles of these distributions.
