Figure 5.
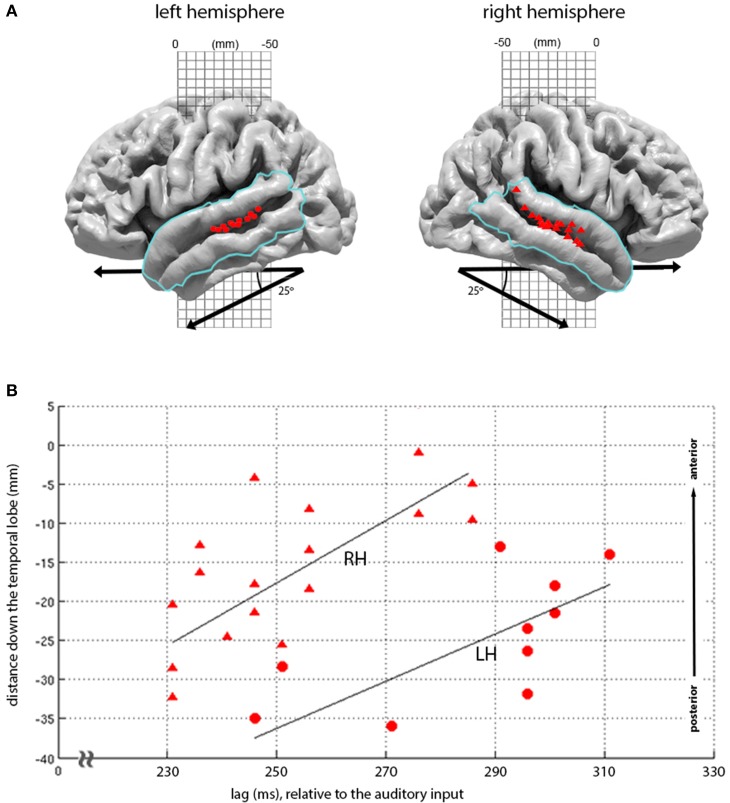
Topography of loudness-sones expression at 210-330 ms lags. (A) Plots the second major cluster of instantaneous loudness-sones expressions rendered onto the LH and RH cortical surface, overlaid with a mask (blue line) covering the superior and middle temporal gyrus). The locations for all vertices displaying significant matches in this mask, for the time period of 210 and 330 ms relative to the auditory input, are displayed as red circles (LH) and red triangles (RH). (B) Plots the same vertex matches, as a joint function of the distance down the temporal lobe (measured down a 25° diagonal off the MNI-space y axis) against the lag of each vertex match. A least-squares linear regression (with the line of best-fit plotted in black) demonstrates a linear relationship between lag and the location of significant vertices (LH, RH: ρ = 0.70, 0.70, p = 0.01, 0.001).

