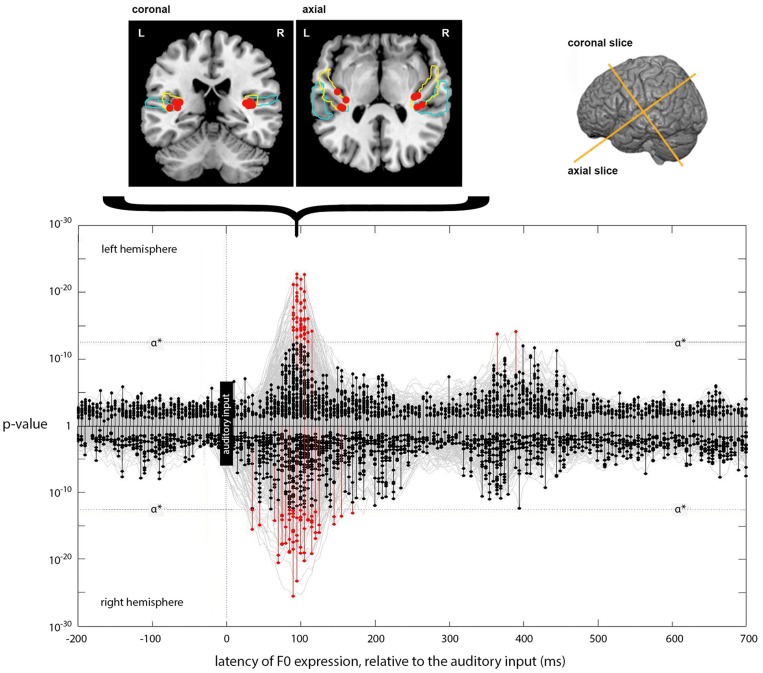
Figure 6.
Expression of the instantaneous F0 model across lags. The main panel plots the expression of the instantaneous F0 model (generating a predicted F0 contour) across processing lags from −200 to +700 ms, relative to the auditory input. Results for left and right hemispheres separately are plotted mirror-wise across the mid-line. Vertices which match the output of the F0 model at or above the stipulated α* (p ~ 3 × 10⁻¹³) are plotted in red. The positions of the most significant four vertices at 90 ms, for both LH and RH, are plotted on the cortical slices above the main panel. These locations are bilateral and symmetric, and are focused around Heschl's Gyrus (colored blue). The MNI-space coordinates for the most significant match in the left and right hemispheres are (−37, −26, 9) and (35, −27, 13), respectively. Later expression also occurs in the left hemisphere at a lag of 365 and 390 ms; located at (−41, −24, 22) and (−40, −25, 22), respectively.

