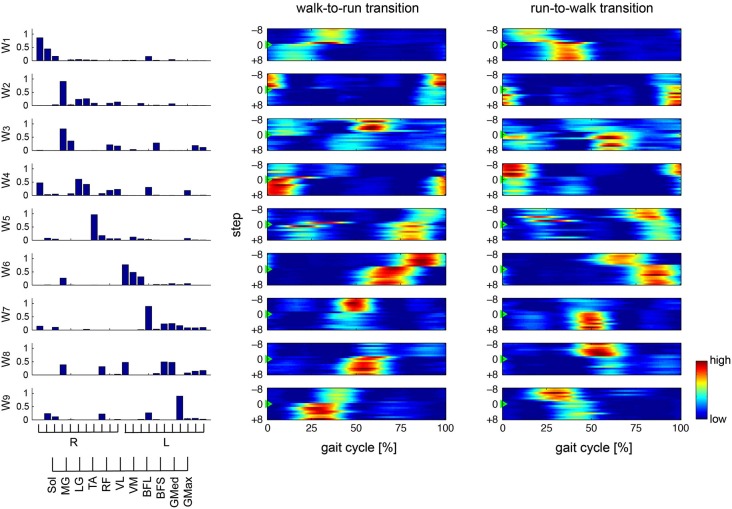
Figure 5.
Muscle synergies and activations in constant speed condition. Muscle synergies and their activation profiles in a representative subject in the constant speed condition are shown. Bar graphs indicate muscle synergy vectors, i.e., weightings of each muscle within the synergy. Color map shows activation coefficients for each synergy across the walk-to-run and run-to-walk gait transitions. The vertical axis shows the gait transition step (defined as the 0th step ±8 gait cycles), and the horizontal axis indicates phase of one gait cycle (from the onset of the right leg to the next; normalized to 200 time bins).

