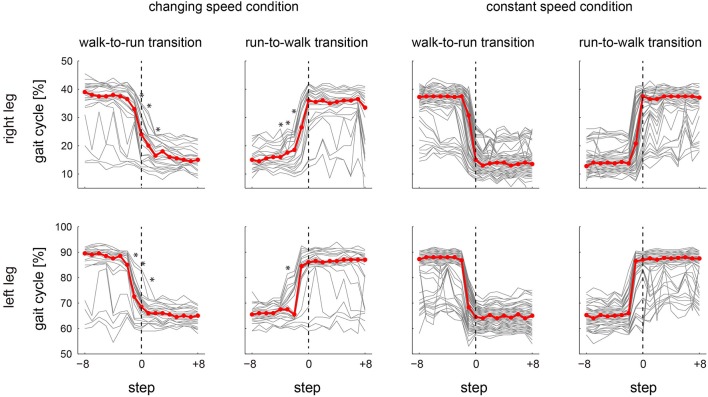
Figure 6.
Peak activation phase in the specific synergies. The peak synergy activation phases, which were composed of the Sol, MG and LG in the right (top) and left (bottom) lower limb, respectively, in the gait transition step (defined as the 0th step ±8 steps) for all subjects are shown. The gray lines indicate the individual trials for all subjects and repetitions. The red lines are the median value across gait steps. The asterisk symbol above the steps in the changing speed condition indicated the significant difference of the activation phases in between changing and constant speed conditions (p < 0.05). See text for detail.

