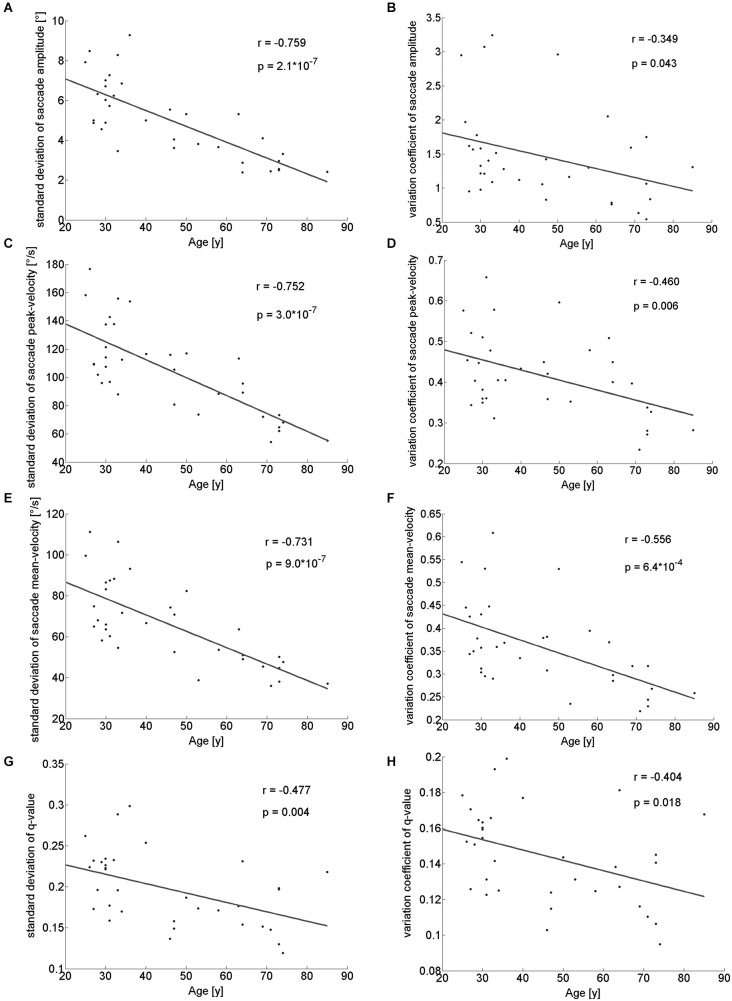
Figure 3.
Standard deviations and variation coefficient of saccade amplitude (A,B), peak- (C,D) and mean-velocities (E,F) and q-value (G,H) in relation to the age of the participants. There is a clearly negative correlation for these parameters indicating a decreased variability of saccadic performance in older participants.

