
Figure 4.
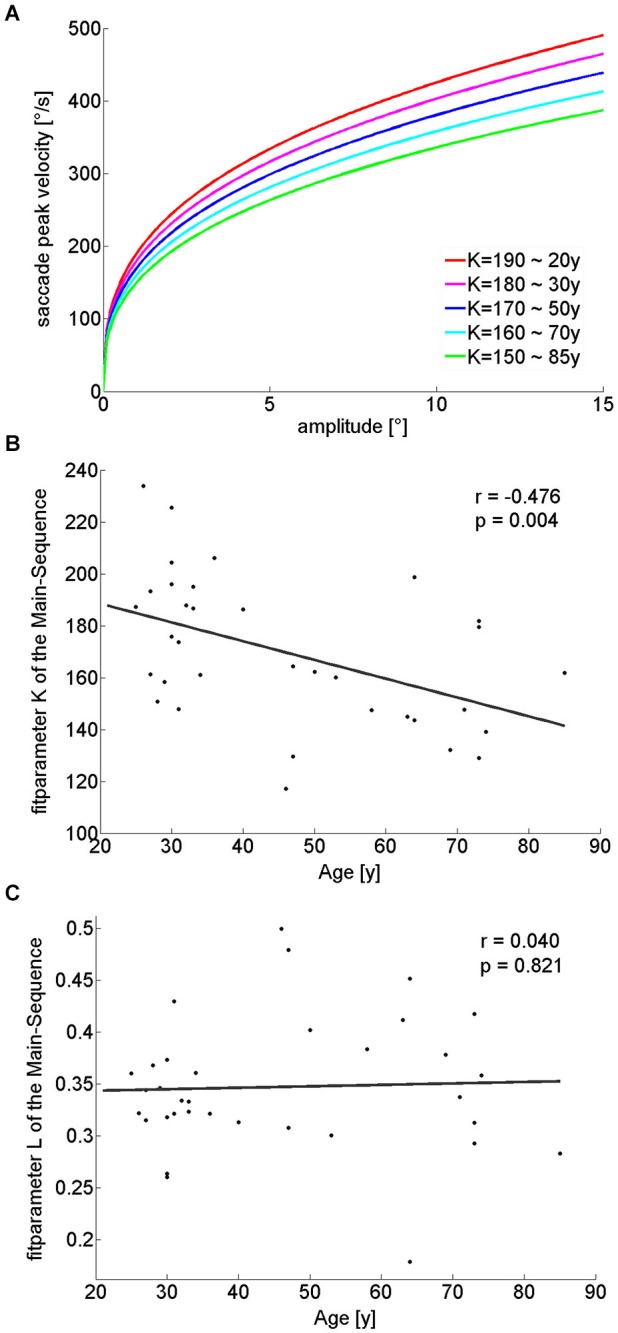
Illustration of Main-sequence power-function fits for different K-values, while the exponent (“L”) remains unchanged (A), each K-value relates to a different age cohort, as extracted from the linear regression of K-value over age (B). L-values were constant at 0.35 for all fits (C). With increasing age, smaller K-values (B) lead to decreasing slopes of the power functions and therefore smaller saccade peak-velocities for the same amplitudes when L-values are constant (C).