Figure 4.

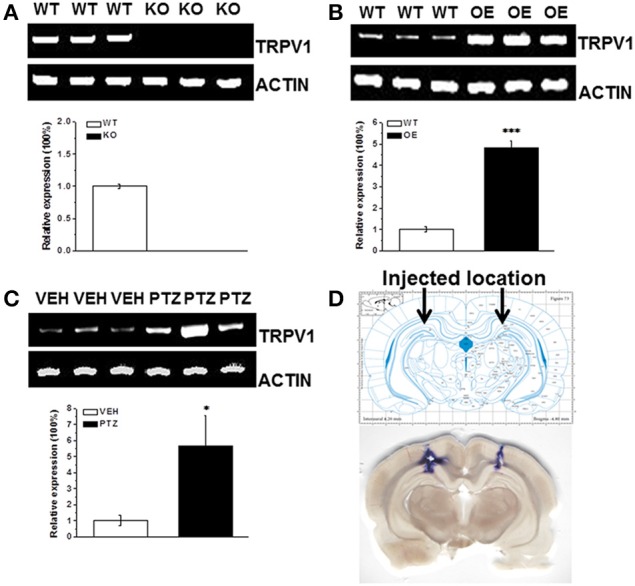
The RT-PCR analysis of TRPV1 expression in hippocampus. (A) The TRPV1 expression was lost in the hippocampus of TRPV1 knockout mice compared with the wild type mice. (B) The RT-PCR revealed increased expression of hippocampal TRPV1 in TRPV1 overexpression mice compared with the wild type mice. (C) The hippocampal TRPV1 expression was significantly increased in PTZ group compared with the vehicle group. (D) Schematic diagram represented the drug injection location in hippocampus (Top panel). The bottom picture was the representative section displaying the location of drug injection in hippocampus by stained with trypanblue from a typical rat. TRPV1: 415 bp; β-actin: 171 bp. All data are expressed as mean ± SEM. *p < 0.05. ***p < 0.001.
