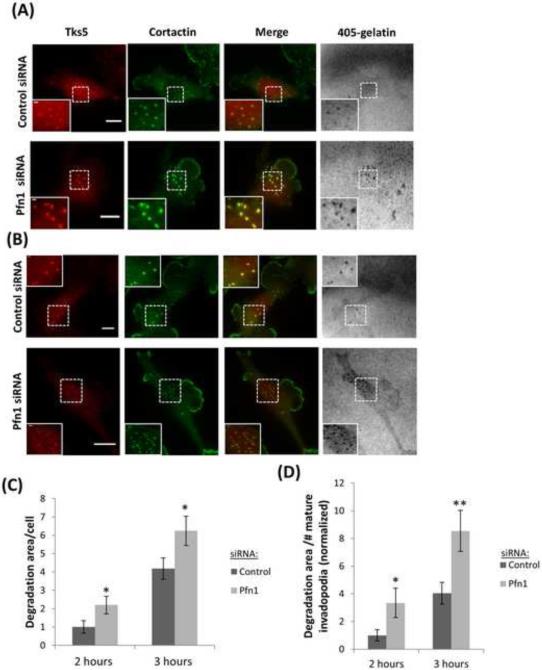
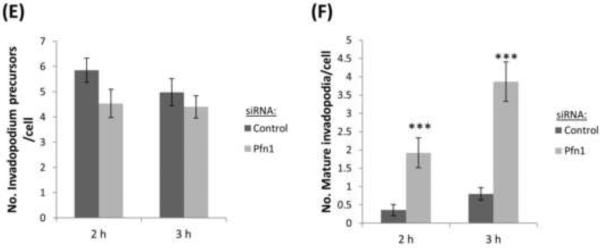
Figure 7. Profilin1-depleted cells have a higher degradation activity by invadopodia.
(A and B) Representative images of MDA-MB-231 cells transfected with control or Pfn1 siRNA and plated on 405-labeled gelatin for 2 h (A) and 3 h (B). Cells were stained for Tks5 and cortactin as invadopodia markers. Bar, 10 μm. Inset shows magnified image of invadopodia in the box, bar, 1μm (C) Quantification of degradation area per cell at 2 h and 3 h after plating and normalized to control at 2 h. n>60 cells; three independent experiments. *, p=0.04 (2 h), *, p=0.03 (3 h). (D) Quantification of invadopodial matrix degradation area per number of invadopodia after 2 h and 3 h plating and normalized to control at 2 h. n>60 fields; three independent experiments. *, p=0.042 (2 h), **, p=0.008 (3 h). (E-F) Quantification of invadopodium precursors and mature invadopodia after 2 h and 3 h plating. n>500 invadopodia, n>60 cells; three independent experiments. ***, p=0.0004 (mature invadopodia at 2 h fix), ***, p=3.43E-07 (mature invadopodia at 3 h fix). Error bars indicate SEM.


