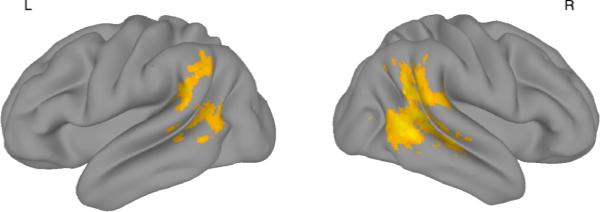
Figure 3. Activation map for the Irrational versus Rational contrast.

Activation is displayed on a cortical surface representation. The color ranges from z = 2.3 to z = 4.1.

Activation is displayed on a cortical surface representation. The color ranges from z = 2.3 to z = 4.1.