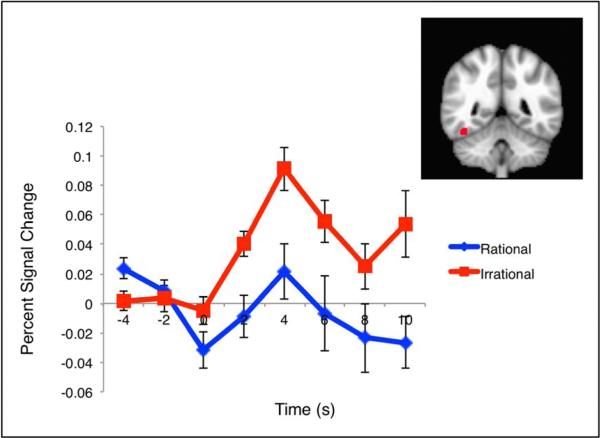
Figure 5. ROI analysis results for the FG: percent signal change during static presentation of faces shown after the movie clips.
Percent signal change averaged across voxels in the independently identified FG ROI (pictured in top right) for the rational (blue) and irrational (red) conditions. There is a significant difference in the peak percent signal change in response to the rational (animate) compared with the irrational (inanimate) condition. Stimulus presentation begins at 0s.

