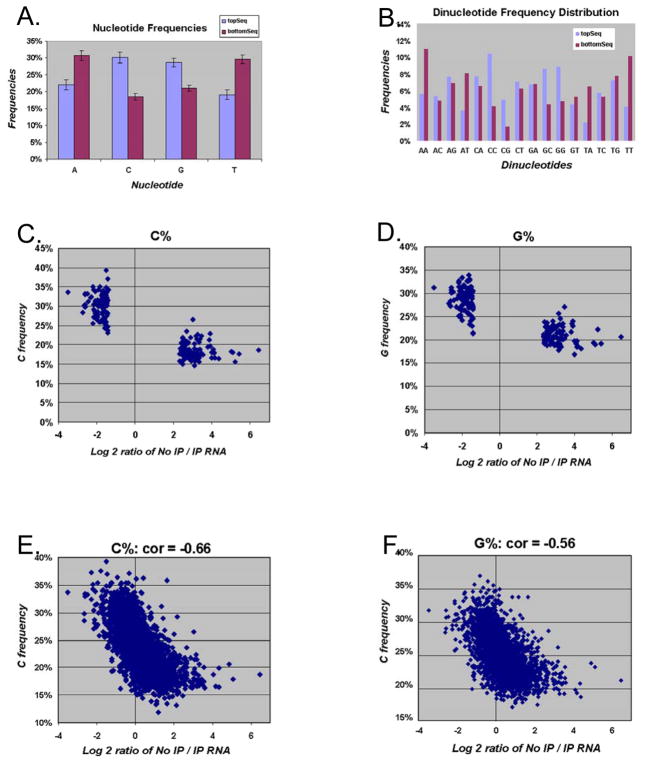
FIGURE 1. Average nucleotide/dinucleotide frequency distribution.
(A) Nucleotide frequency distribution of the top 100 IP-enriched genes / bottom 100 IP-non-enriched genes are compared. Error bars represent standard deviation. Dinucleotide frequency distribution of the top 100 IP-enriched genes and the bottom 100 IP-non-enriched genes are compared. Error bars represent standard deviation (C, D). Percentage of C nucleotide content (C) and percentage of G nucleotide content (D) compared to the log2 ratio of No IP /IP to for the top 100 IP enriched and 100 bottom non-enriched genes. (E and F) Percentage of C nucleotide content (E) and percentage of G nucleotide content (F) compared to the log2 ratio of No IP /IP to for 2500 randomly extracted unique genes.

