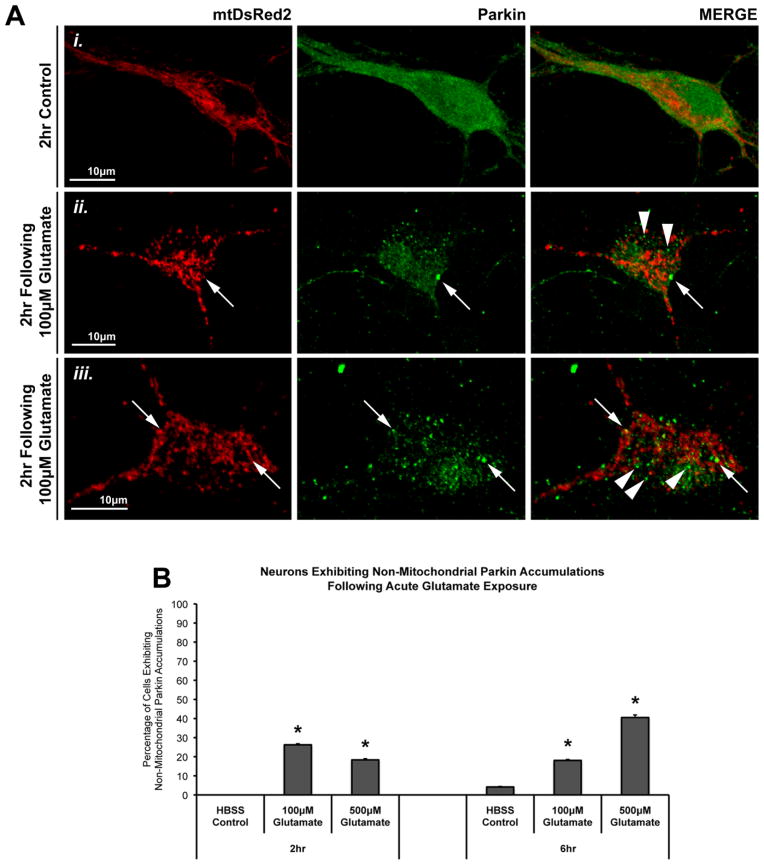
Figure 2. Mitochondrial and non-mitochondrial Parkin accumulations following glutamate exposure.
In the same studies described in Figure 1, we observed that, in addition to Parkin (green) localizing to mitochondria (mtDsRed2; red) (Aii, iii, arrows), some glutamate-exposed cells exhibited punctate Parkin accumulations that were not associated with mitochondria. These Parkin puncta were located either unassociated with any mitochondria or near, but not on, mitochondria (Aii, iii, arrowheads). (B) Graph of the observed percentage of neurons exhibiting non-mitochondrial Parkin localization following glutamate exposure (37–72 individual cells across 5–6 independent neuronal preparations; * = p<0.05 from respective time-point control, +/− SEM). For this assessment, a cell exhibiting non-mitochondrial Parkin accumulation was considered positive independent of whether or not that cell also exhibited Parkin-mitochondria localization.

