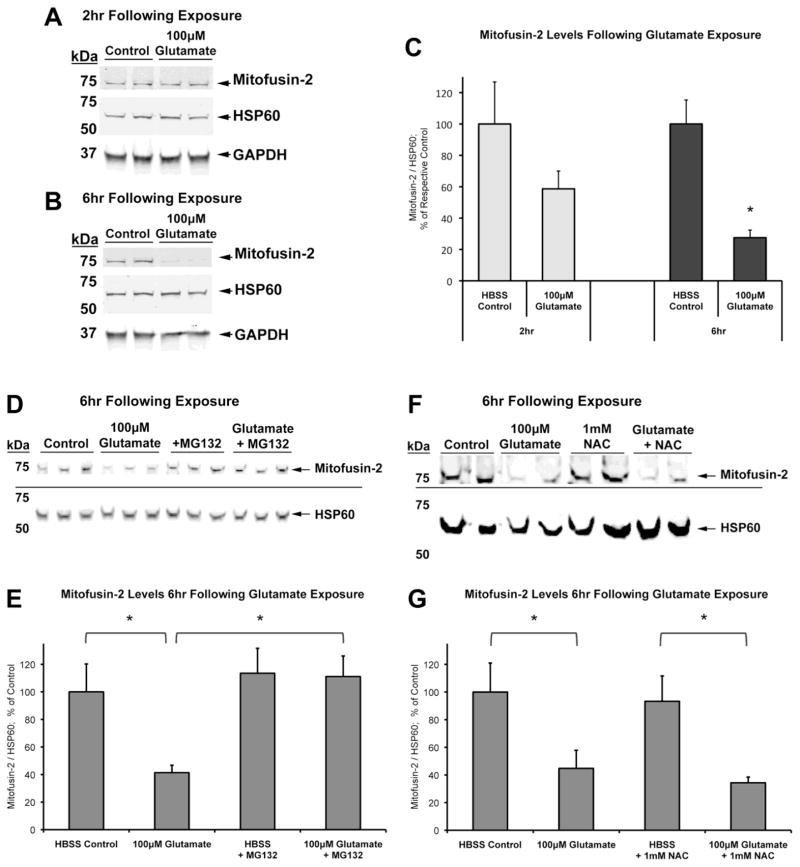
Figure 7. Effect of acute glutamate exposure on cellular levels of mitofusin-2.
On DIV15, non-transfected cortical neurons were treated (HBSS Control or 100μM Glutamate) and harvested. Western blot analyses were conducted for mitofusin-2 (Mfn2) and HSP60 at (A) 2hr and (B) 6hr following treatment. (C) Graph of Mfn2 levels with respect to HSP60 mitochondrial loading control at 2hr and 6hr (n=8–9; * = p<0.05 from respective time-point control, +/− SEM). (D) Western blot analysis of neurons co-treated with or without proteasome inhibitor MG132 and 100μM glutamate, 6hr following exposure. (E) Graph of Mfn2 levels with respect to HSP60 mitochondrial loading control at 2hr and 6hr (n=3; * = p<0.05, +/− SEM). (F) Western blot analysis of neurons co-treated with or without 1mM NAC and 100μM glutamate, 6hr following exposure. (G) Graph of Mfn2 levels with respect to HSP60 mitochondrial loading control at 6hr (n=6; * = p<0.05, +/− SEM).

