Figure 1.

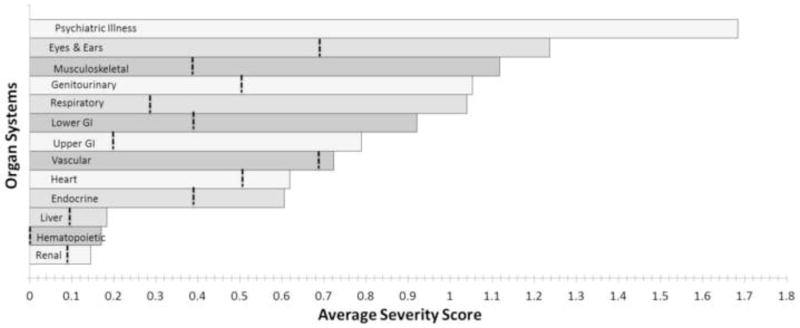
Average severity score (0–4) of each individual organ system. The dotted vertical line represents means for previously reported healthy normal subjects [10].

Average severity score (0–4) of each individual organ system. The dotted vertical line represents means for previously reported healthy normal subjects [10].