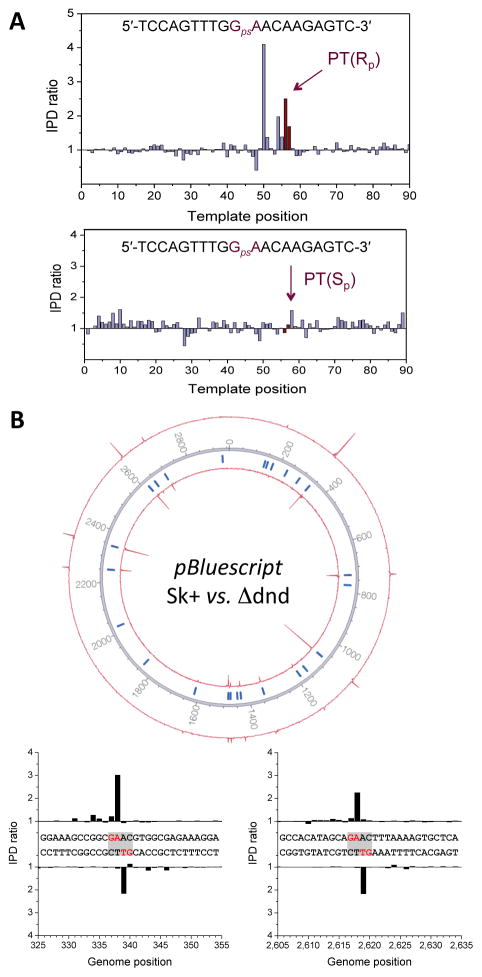
Figure 2.
Validation of the single-molecule real-time (SMRT) method for mapping PT modifications in genomes. To validate the SMRT method, experiments were performed using (A) oligodeoxynucleotides containing Sp and Rp configuration PT modifications and (B) a pBluescript SK+ plasmid grown in Salmonella enterica serovar Cerro 87 and a dndD knockout strain as a control. (A) Upper and lower panels show the kinetic signals for SMRT sequencing of oligodeoxynucleotides containing PT in the Rp and Sp configurations, respectively. (B) Circos plot of kinetic signals of pBluescript plasmids grown in Salmonella enterica serovar Cerro 87 (±DndD). The inner and outer circles denote IPD ratios for the forward and reverse DNA strands, respectively. Tick marks denote all occurrences of the 5′-GAAC-3′/3′-CTTG-5′ sequence across the plasmid (for IPD ratios at these locations see Supplementary Table 1). The lower panel shows examples for kinetic signals at two locations on the plasmid.

