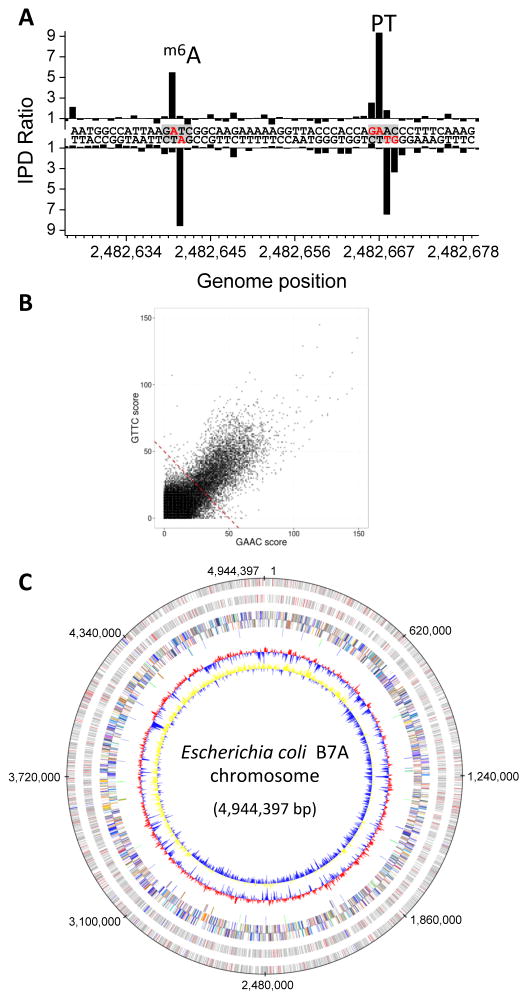
Figure 3.
Detection of PT by SMRT sequencing across the genome of E. coli B7A. (A) Example IPD ratio plot showing one instance of PT in a 5′-GAAC-3′/3′-CTTG-5′ sequence context. A nearby adenine methylation signal at 5′-Gm6ATC-3′/3′-CTm6AG-5′ is also shown for comparison. (B) Correlation of opposite DNA strand kinetic signals at 5′-GAAC-3′/3′-CTTG-5′ sites across the B7A genome. The dashed line indicates the threshold for calling sites modified. (C) PT annotation across the B7A chromosome. From outer to inner circles: 1 and 2 (forward, reverse strands): PT sites in ORFs (gray), in non-coding RNA (blue) and non-coding regions (red); 3 and 4: predicted protein-coding sequences colored according to COG function categories; 5: tRNA/rRNA operons; 6: GC content; 7: GC skew.

