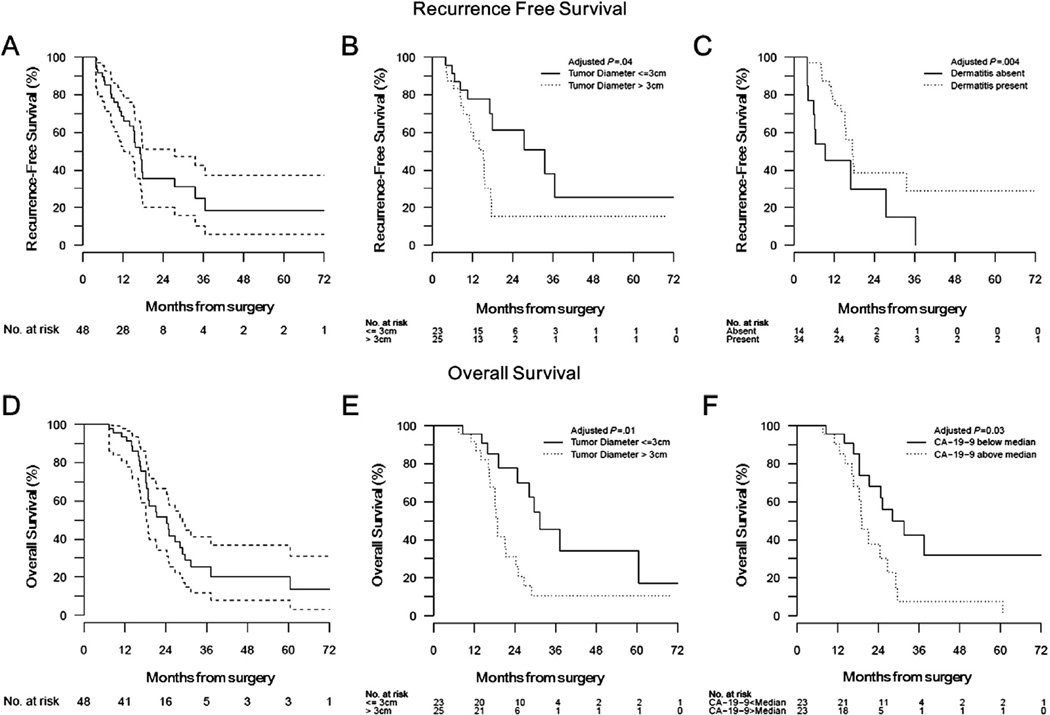
Fig. 1.
Kaplan-Meier curves showing (A) recurrence-free survival (RFS) (solid line) with 95% confidence intervals (dashed lines); (B) RFS stratified by the absence (solid line) or presence (dotted line) of dermatitis during erlotinib therapy; (C) RFS stratified by tumor diameter less than (solid line) or greater than (dotted line) 3 cm; (D) overall survival (OS) (solid line) with 95% confidence intervals (dashed lines); (E) OS stratified by tumor diameter less than (solid line) or greater than (dotted line) 3 cm; (F) OS stratified by baseline CA19-9 less than (solid line) or greater than (dotted line) the median value for the cohort (32.3 U/mL). P values shown are derived from univariate analyses; multivariate results are discussed in the text.

