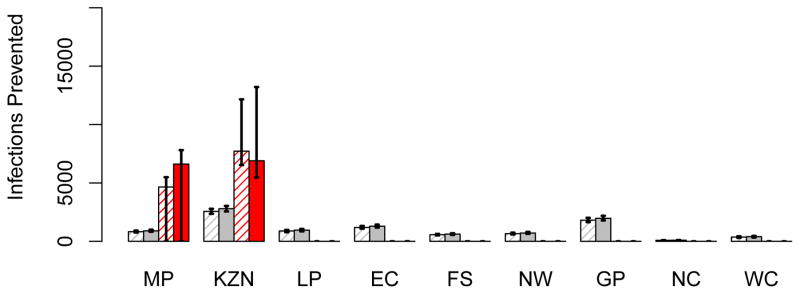
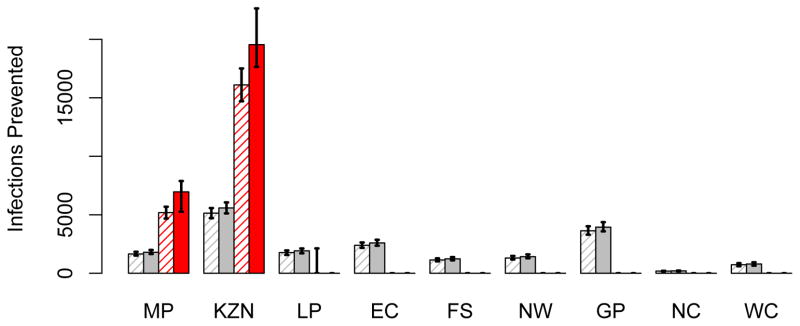
Figure 9. A comparison of the number of HIV infections prevented by the utilitarian and the egalitarian strategy.


The histograms in (A) show the number of HIV infections prevented in women in each province, in the first year of the rollout, assuming 50 million microbicides are available: grey data show the results of the egalitarian plan (solid grey columns based on high adherence, striped grey columns on moderate adherence) and red data show the results of the utilitarian plan (solid red columns based on high adherence, striped red columns on moderate adherence). The histograms in (B) are similar to those in A, but are based on a supply of 100 million microbicides. In both A and B the results for the egalitarian strategy are based on the assumption that Mpumalanga and KwaZulu-Natal are the optimal two-province combination to use for geographic targeting (see Table 1). Province abbreviations: Mpumalanga (MP), KwaZulu-Natal (KZN), Limpopo (LP), Eastern Cape (EC), Free State (FS), North West (NW), Gauteng (GP), Northern Cape (NC), and the Western Cape (WC).
