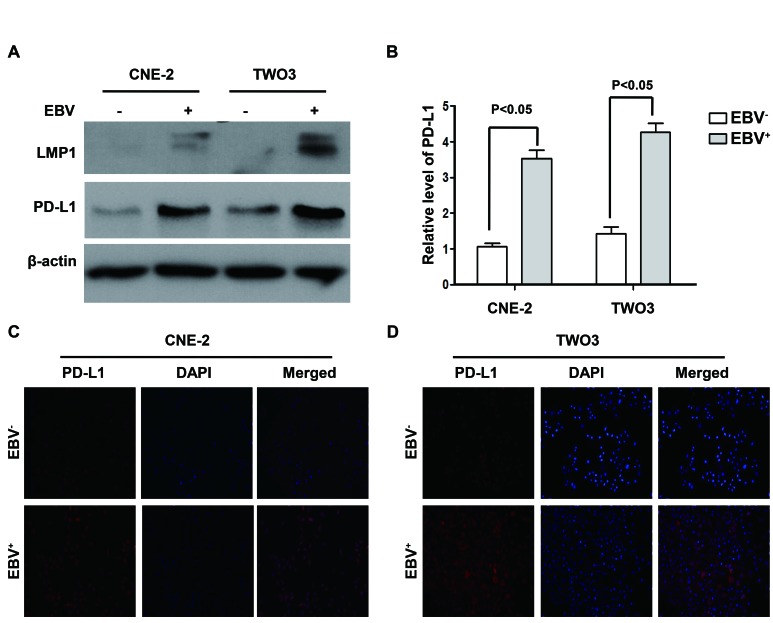
Figure 2. PD-L1 expression was induced by EBV infection in human nasopharyngeal carcinoma cell lines.
(A) The protein expression level of PD-L1 and LMP1 (detected by western blot) in the constructed EBV-positive (CNE-2-EBV+ and TWO3- EBV+) and EBV-negative (CNE-2 and TWO3) parental cell lines. β-actin was used to verify equal loading. (B) Quantified protein expression level of PD-L1 in CNE-2, CNE-2- EBV+, TWO3 and TWO3- EBV+ cell lines using Quantity One software (Bio-Rad Laboratories, Hercules, CA). (C) The localization of PD-L1 (orange signal) in CNE-2 and CNE-2- EBV+ cell lines shown by immunofluorescence counterstained with DAPI (blue signal). (D) The localization of PD-L1 (orange signal) in TWO3 and TWO3- EBV+ cell lines shown by immunofluorescence counterstained with DAPI (blue signal). Representative data of three independent experiments are shown.

