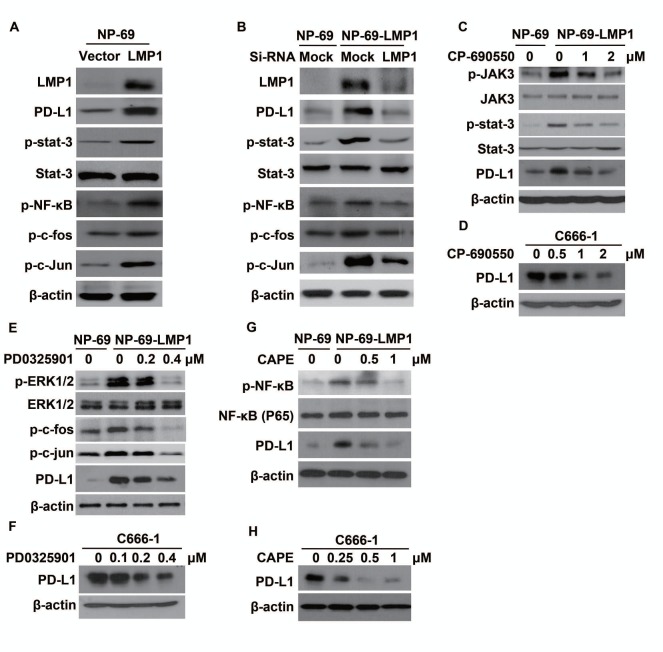
Figure 4. LMP1 induced PD-L1 expression through the downstream pathways involving JAK3/STAT3, AP-1 and NF-κB.
(A) The protein expression level of LMP1, PD-L1, p-STAT3, STAT3, p-NF-κB, p-c-fos and p-c-Jun (detected by western blot) in NP-69-vector and NP-69-LMP1 stable cell lines. (B) The protein expression level of LMP1, PD-L1, p-STAT3, STAT3, p-NF-κB, p-c-fos and p-c-Jun (detected by western blot) in NP-69-vector and NP-69-LMP1 stable cell lines after transfected with Mock-siRNA or LMP1-siRNA. (C) The protein expression alteration of p-JAK3, JAK-3, p-STAT3, STAT3, PD-L1 in NP-69-LMP1 or NP-69 cell lines treated with 0, 1, 2 μM CP-690550, a selective JAK3 inhibitor for 72 hours. (D) C666-1 cells were treated with 0, 0.5, 1.0, 2.0 μM CP-690550 for 72hours and the level of PD-L1 was detected by western blot. (E) The protein expression alteration of p-ERK1/2, ERK1/2, p-c-fos, p-c-Jun, PD-L1 in NP-69-LMP1 or NP-69 cell lines treated with 0, 0.2, 0.4 μM PD0325901, a selective MEKs inhibitor for 72hours. (F) C666-1 cells were treated with 0, 0.1, 0.2, and 0.4 μM PD0325901 for 72 hours and the level of PD-L1 was detected by western blot. (G) The protein expression alteration of p-NF-κB, NF-κB, PD-L1 in NP-69-LMP1 or NP-69 cell lines treated with 0, 0.5, and 1.0 μM Caffeic Acid Phenethyl Ester (CAPE), a selective p-NF-κB inhibitor for 72 hours. (H) C666-1 cells were treated with 0, 0.25, 0.5, 1.0 μM CAPE for 72 hours and the level of PD-L1 was detected by western blot. All experiments were repeated at least three times and representative data are shown. β-actin was used to verify equal loading.

