
Figure 4. Notch target genes and members of the Notch signalling pathway are overexpressed in CYLD defective tumours.
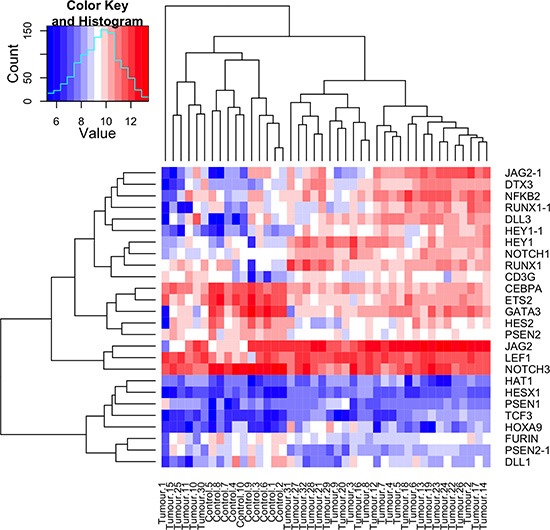
A heatmap plot illustrating the expression levels of Notch signalling pathway and target genes in 32 CYLD defective tumours and 10 controls. Notch target genes and signalling pathway members that were differentially expressed with a p value of <0.05 across an average of 32 tumours compared to an average of 10 controls (tumours and controls are indicated at the bottom of the heatmap) were included, and transcript expression levels at a single sample level are illustrated in the heatmap. Overexpressed transcripts are shown in red and transcripts that are underexpressed are shown in blue, with gene names indicated on the right hand side of the figure. Where data from multiple transcripts for a single gene were available, these are indicated with a numerical suffix (n = 4). Clustering by similarity is shown as determined by Euclidean distance.