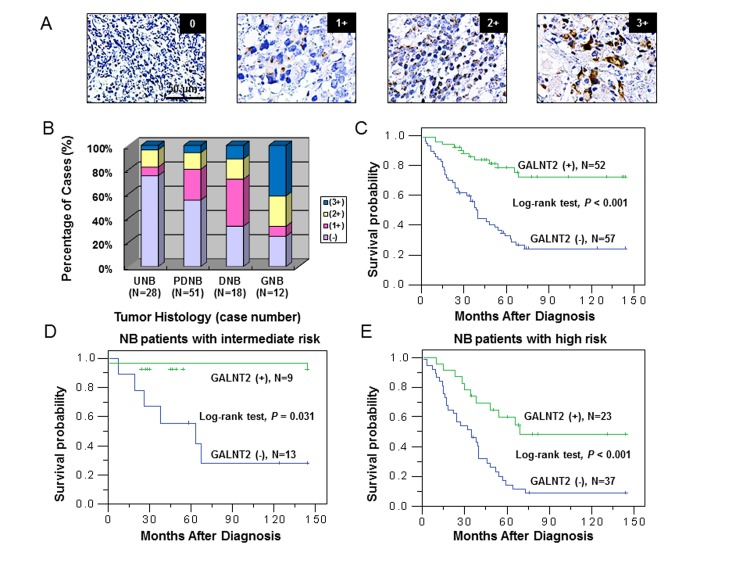
Figure 1. GALNT2 expression is correlated with tumor histology and survival probability of NB patients.
(A) Immunohistochemical images of NB tumors representing the four categories of GALNT2 expression (0 to 3+). Scale bar = 50 μm. Original magnification, 400×. (B) Percentage distribution of GALNT2 expression in tumors with UNB, PDNB, DNB, or GNB histology. (C) Kaplan-Meier survival analysis according to the expression of GALNT2 in 109 NB patients. P value was calculated using log-rank test. (D) Kaplan-Meier survival analysis according to the expression of GALNT2 in NB patients with intermediate risk. P value was calculated using log-rank test. (E) Kaplan-Meier survival analysis according to the expression of GALNT2 in NB patients with high risk. P value was calculated using log-rank test.

