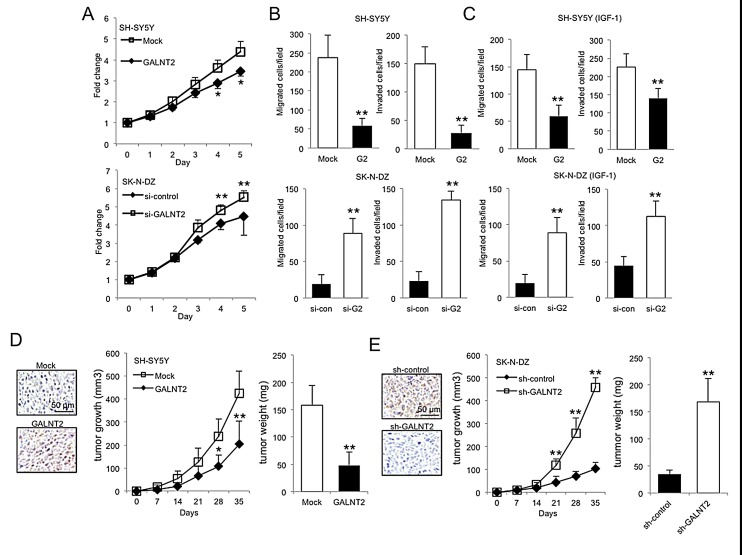
Figure 3. Effects of GALNT2 on malignant phenotypes of NB cells.
(A) MTT assays indicated that GALNT2 overexpression significantly suppressed SH-SY5Y cell growth (top panel), whereas GALNT2 knockdown in SK-N-DZ cells enhanced cell growth compared with controls (bottom panel). Cells were cultured in DMEM containing 10% FBS, and MTT reagent was added at the indicated times. The results were standardized by setting the value at day 0 to 1.0. Data are presented as mean ± SD from three independent experiments. Error bar = SD. *P < 0.05, **P < 0.01. (B–C) GALNT2 overexpression in SH-SY5Y cells (G2) significantly inhibited FBS- and IGF-1-induced migration and invasion compared with controls (Mock) (upper panels). GALNT2 knockdown in SK-N-DZ cells (si-G2) enhanced migration and invasion induced by FBS or IGF-1 compared with controls (si-con) (lower panels). Migration and invasion were analyzed by transwell migration and Matrigel invasion assays, respectively. Cells were seeded in serum-free DMEM and the chemoattractant in the lower chamber was 10% FBS or 50 ng/mL IGF-1. Data are presented as mean ± SD from three independent experiments. Error bar = SD. **P < 0.01. (D–E) GALNT2 suppressed tumor growth in mice. SH-SY5Y (D) and SK-N-DZ (E) transfectants were subcutaneously injected to mice. After implantation, tumor sizes were measured twice a week. At day 35, tumors were excised, weighed, and subjected to immunohistochemical staining using the anti-GALNT2 antibody (color images). Scale bar = 50 μm. Original magnification, 400×. Data represent the mean ± SD; n = 4 for each group. *P < 0.05, **P < 0.01.

