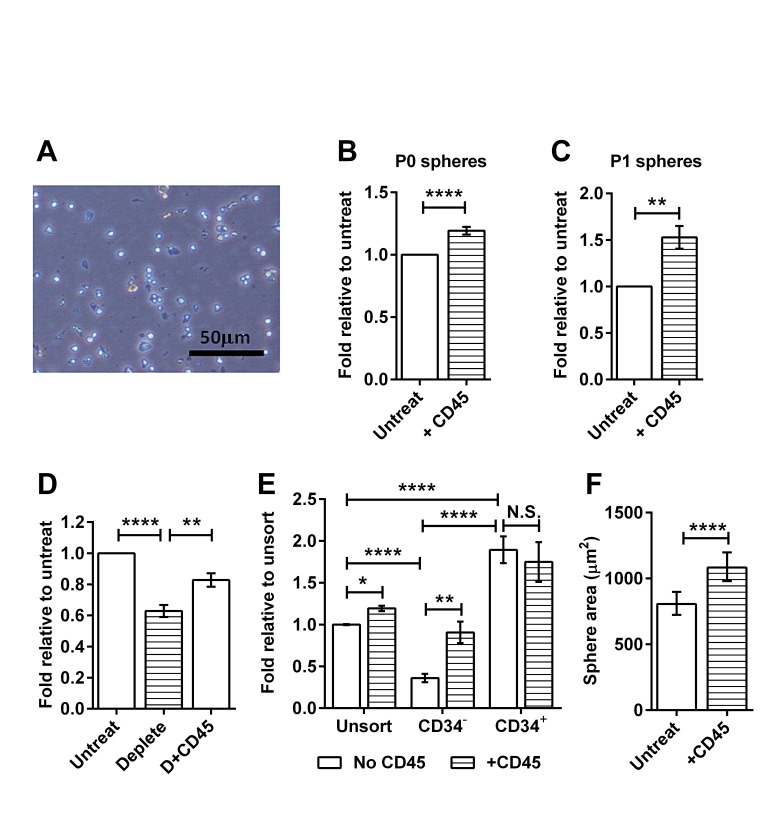
Figure 2. CD45+ immune cells stimulate melanosphere formation.
For panels B to E, data are expressed as fold change in sphere-forming efficiency relative to untreated or unsorted cells as indicated on the y-axis. Bars represent mean ± SE, * P < 0.05, **P < 0.01, **** P < 0.0001, N.S. not significant. (A) Brightfield image of CD45+ cells cultured alone in stem cell medium for 5 days. (B) Passage 0: Freshly isolated unsorted tumor cells were cultured with or without CD45+ immune cells isolated from tumors, two-tailed Mann-Whitney test. (C) Passage 1: Untreated P0 spheres were dissociated and recultured with or without CD45+ immune cells isolated from tumors, two-tailed Mann-Whitney test. (D) Graph comparing sphere-forming efficiency of untreated tumor cells, tumor cell preparations with CD45+ cells removed (deplete) and CD45-depleted tumor cell preparations with CD45+ cells added back (D+CD45), 1-way ANOVA. (E) Graph comparing sphere-forming efficiency from sorted CD34− and CD34+ TICs cultured with or without CD45+ cells, 2-way ANOVA. (F) Effect of CD45+ cells on the size of CD34− spheres. Bars represent geometric mean ± 95% CI, two-tailed Mann-Whitney test.

