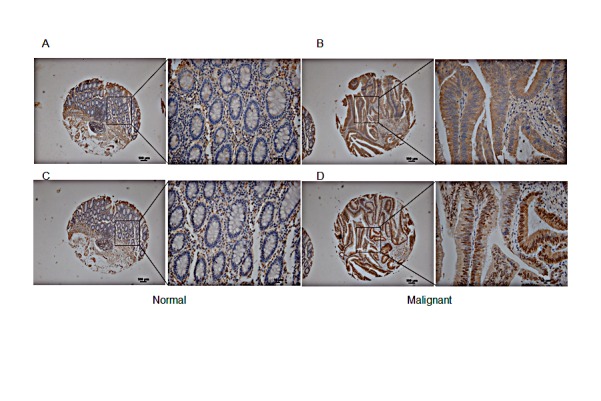
Figure 5. Immunohistochemical analysis of total and phospho-cPLAα at Serin human CRC tissue array.

Inset AC: normal colon mucosa exhibited relatively low levels of total cPLA2α (A) and phospho-cPLA2α (C). Inset BD: CRC tissue had stronger total cPLA2α (B) and phospho-cPLA2α (D) in malignant epithelial cells. Low magnification 100×. Scale bar = 100 μm. High magnification 400×. Scale bar = 10 μm.
