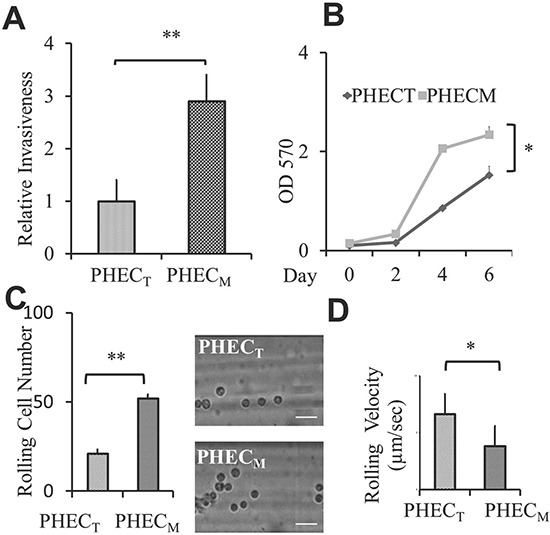
Figure 1. PCa cell aggressiveness is correlated with their rolling/adhesion capacity.

(A) Relative invasiveness of BPH-1derived PHECT and PHECM PCa cells. The Bar graph represents invasive cells per well using 24 well invasion chambers, the average of at least three experiments. (B) Line graph represents the MTT assay for cell proliferation. The results represent the average of at least three experiments. (C) Rolling cell number comparing the rolling behavior of BPH-1derived PHECT and PHECM cell lines using the microchannel system under wall shear stress of 1 dyne/cm2. Bar graph represents the average rolling/adhesion cell number of consecutive 10 frames of a video (200X) of one experiment. Pictures represent one frame. Scale bar represents 50 μm. (D) Rolling velocity of BPH-1derived PHECT and PHECM cell lines using the microchannel system under wall shear stress of 1 dyne/cm2. Graph represents the average rolling cell velocity of 10 cells of one experiment. Error bars indicate SEM. *, P < 0.05; **, P < 0.01.
