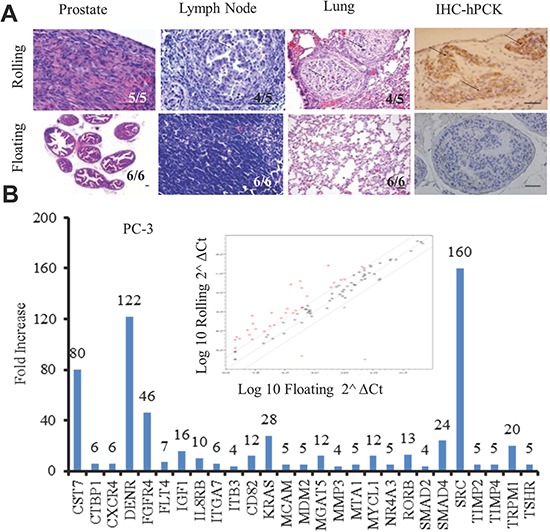
Figure 3. Rolling PCa cells demonstrate higher metastatic behavior in vivo and elevated metastatic related genes.

(A) Orthotopic xenograft mouse model was used to determine the metastatic potential of rolling and floating PCa cells in vivo. Mice were sacrificed three months after the implantation, and tissues were collected for histological examination. Histogram of first three columns showing the H&E staining of the rolling (upper row) and floating (lower row) mouse prostate tumors, lymph node and lung. The 4th column represents the IHC staining of human pan cytokeratin in the rolling (upper) and floating (lower) prostate. Scale bar represents 50 μm. (B) Human metastatic gene array of 84 metastatic related genes. Scatter plot shows the up- and down-regulated genes (red dots for up and green dots for down) in sorted PC-3 cells and bar graph represents the upregulated metastatic genes (>2 fold) in rolling PC-3 cells, compared with floating.
