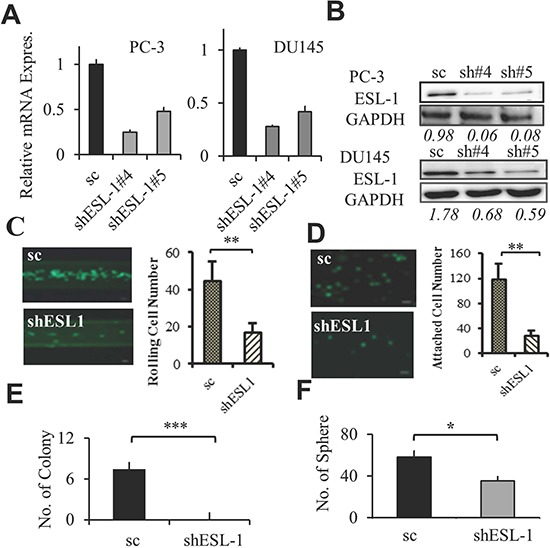
Figure 5. ESL-1 is responsible for PCa rolling and aggressiveness.

(A) Expression of ESL-1 in shESL-1 stable clones was determined by Q-PCR. Bar graph represents the fold reduction of ESL-1 expression in shESL-1clones compared to scramble control of PC-3 and DU145 cell lines. (B) Western blot analysis of ESL-1 expression in shESL-1clones compared to scramble control of PC-3 and DU145 cell lines. (C) Determining the rolling cell numbers of the shESL-1and scESL-1 PC-3 PCa cells using the microchannel system under flow of shear stress 1 dyne/cm2. Bar graph represents the average rolling/adhesion scESL-1 and shESL-1 PC-3 cell number of consecutive 10 frames of videos (100X) of one experiment. A representative picture is shown. Scale bar represents 50 μm. (D) Comparing the static adhesion between the shESL-1and scESL-1 PC-3 cells. Bar graphs represent the average adherent cell numbers of scESL-1 and shESL-1 PC-3 on HUVEC cells per well and the picture represents 50x view of the attached shESL-1and scESL-1 of PC-3 adherent cells. Scale bar represents 50 μm. (E) Anchorage independent soft agar colony formation assay with scESL-1and shESL-1 of PC-3 cell line. Colonies were counted after 28 days of culture. Bar graph represents the average colony numbers of three wells in 6 well plate (each were triplicated). (F) 3D sphere forming assay of scESL-1and shESL-1 of DU145 cell line. Bar graph represents average sphere numbers in three wells of 96 well plates. Results represent the average of at least 3 experiments. Error bars indicate SEM. *, P < 0.05; **, P < 0.01.
