
Figure 4. Knockdown of RFPL3 inhibits tumor growth by downregulating hTERT expression in vitro and in vivo.
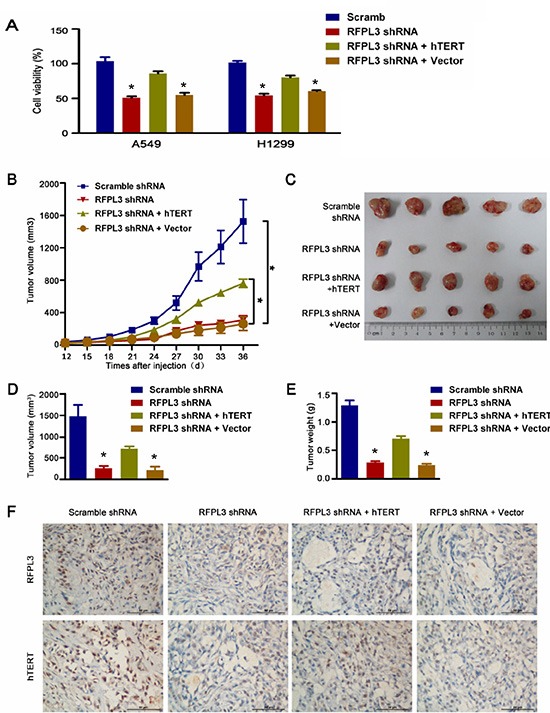
(A) The stable A549 and H1299 cell lines were generated: (1) RFPL3 shRNA; (2) non-target control shRNA; (3) RFPL3 shRNA + hTERT; (4) RFPL3 shRNA + Control empty vector (EV). At 48 h after cells plated in 96-well plates, cell viability was measured using an MTT assay. The mean and SE obtained from three independent experiments are plotted. (B)Tumor growth curves: (*P < 0.05). (C) The harvested tumor grafts 36 days after inoculated subcutaneously into the flank of the nude mice. (D) Tumor volumes ± SE in nude mice. N = 5. (E) Mean tumor weights ± SE in nude mice. (F) Immunohistochemistry of RFPL3 and hTERT from tumor xenografts (400x magnification).