
Figure 5. RFPL3 expression is positively correlated with hTERT expression in lung adenocarcinoma specimens and lung cancer cell lines.
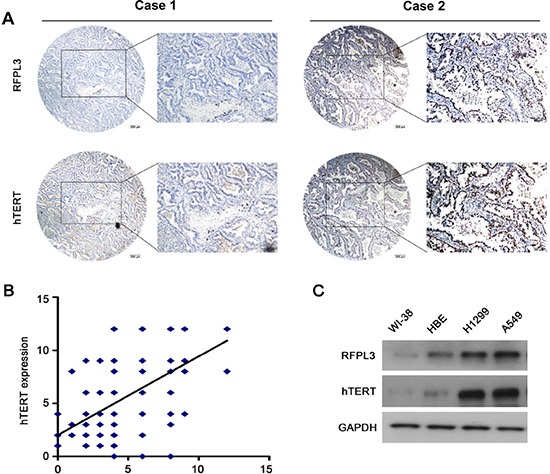
(A) Representative immunohistochemical staining examples of low or high RFPL3 and hTERT expression in the serial sections from the same tumor tissues are shown. Scale bar, 200 μm. Case 1 and 2 means two different patients. (B) The tissue sections were quantitatively scored according to the percentage of positive cells and staining intensity as described in Materials and Methods. The percentage and intensity scores were multiplied to obtain a total score (range, 0–12). RFPL3 expression levels correlated positively with hTERT expression levels in lung adenocarcinoma samples (Pearson's correlation test, r = 0.639; P < 0.001). (C) The expression of RFPL3 and hTERT proteins in the total cell lysates of lung normal cells and cancer cells were analyzed by Western blot.