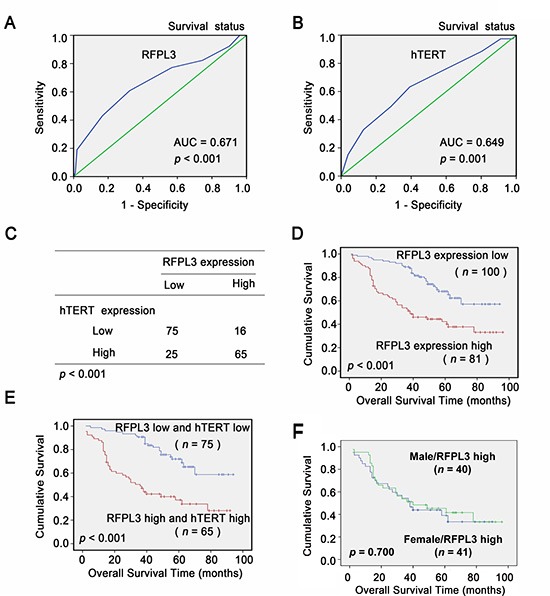
Figure 6. Overexpression of RFPL3 indicates a poor prognosis.

A, B, ROC curve analysis was used to determine the cut-off score for high expression of RFPL3 and hTERT protein in lung adenocarcinoma tissues. The sensitivity and specificity for OS were plotted: (A) RFPL3; p < 0.001 (B) hTERT; p = 0.001. (C) The protein level of RFPL3 correlates positively with the protein level of hTERT in lung adenocarcinoma tissues (P < 0.001, χ2 tests). (D) Kaplan–Meier analysis of overall survival with high RFPL3 expression ( p < 0.001, log-rank test). (E) Kaplan–Meier analysis of overall survival with high or low RFPL3 and hTERT expression ( p < 0.001, log-rank test). (F) Kaplan–Meier analysis of overall survival of male (n = 40) and female patients (n = 41) with high RFPL3 expression ( p = 0.700).
