
Figure 4. TSPAN1 is overexpressed in CRC and its levels are inversely correlated with the levels of miR-638.
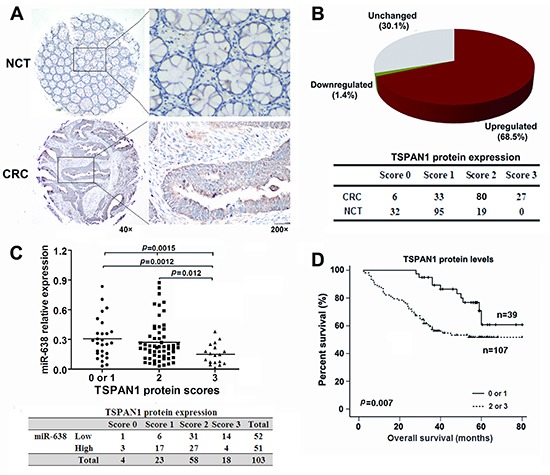
(A) Immunohistochemical staining of TSPAN1 in 146 tumor tissues and the adjacent noncancerous tissues (NCTs). Brown cytoplasmic TSPAN1 staining was observed in CRC tissues but nearly absent in the normal epithelia. (B) TSPAN1 protein expression was frequently increased in the tumor tissues compared to the matched NCTs. (C) The expression levels of TSPAN1 negatively correlated with the miR-638 levels in CRC tissues (Spearman r =−0.341, p <0.0001; Chi-Square=12.084, p = 0.005). (D) Overall survival analysis based on the expression levels of TSPAN1. The groups were ranked according to the TSPAN1 staining intensity. The percent of overall survival in patients with low TSPAN1 expression (scored 0 or 1) was significantly higher than that of the patients with high TSPAN1 expression (scored 2 or 3) (Log-rank=7.272, p =0.007).