
Figure 1. A vast array of genes responds selectively to Doxorubicin and TNF⍺ in MCF7 cells.
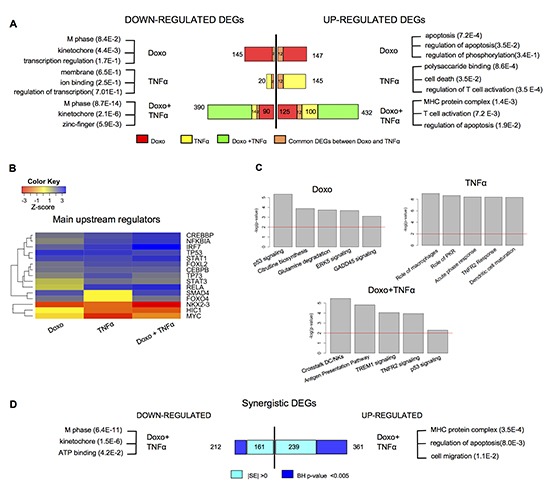
(A) Number of DEGs identified after single or combined treatment (see Methods for statistical filters). Most significant gene ontology terms of down- or up-regulated DEGs, according to DAVID (http://david.abcc.ncifcrf.gov). (B) Predicted upstream regulators of the DEGs for the indicated treatments, according to IPA (IPA, http://www.ingenuity.com). The color code reflects the enrichment or depletion of the listed transcription factors targeting the DEGs from the array analysis. (C) Statistically relevant pathways predicted to be modulated in response to the indicated treatments according to IPA. (D) Number of DEGs that are synergistically regulated by the double treatment according to two different statistical filters (see Materials and Methods). The most significant gene ontology terms are also indicated.