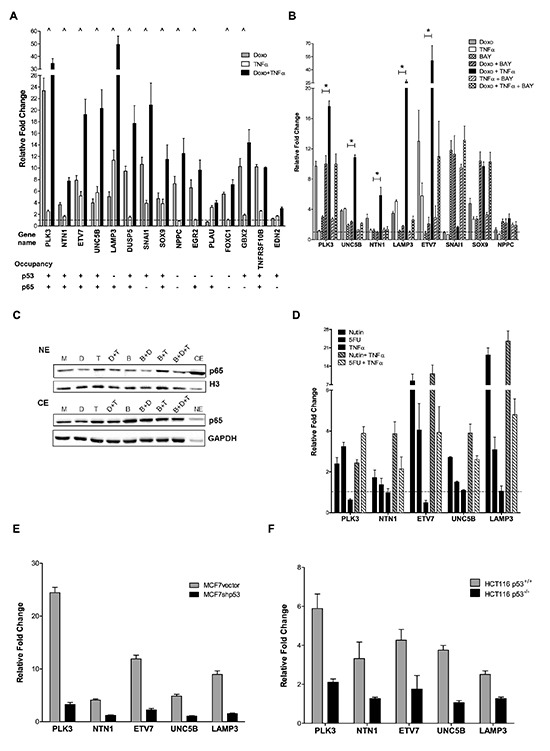
Figure 2. p53- and p65-dependent up-regulation of selected synergistic DEGs.

(A) Twelve out of fifteen selected synergistic DEGs were validated by qPCR. Plotted are the average fold change relative to the mock condition and three reference genes (GAPDH, B2M, ACTB) and the standard deviations of three biological replicates. “^” marks genes responding in synergistic manner to the double treatment. p53 and p65 occupancy data from available ChIP-seq datasets are summarized below each gene name. (B) Impact of the NFκB inhibitor BAY 11-7082 on the synergistic gene expression response plotted as in panel A. “*” Significant inhibition of by BAY when combined to Doxo + TNF⍺ (t-test, p<0.01). NPPC and SNAI1 were also tested but their expression levels were not affected by BAY treatment. (C) p65 nuclear (NE) and cytoplasmic (CE) relative protein levels under the different treatments used in panel B. M = mock; D = Doxo; T = TNF⍺; B = BAY. Proteins were fractionated as described in Materials and Methods. GAPDH and histone 3 (H3) served as controls for cytoplasmic and nuclear fraction respectively. As controls, a cytoplasmic mock fraction sample (CE) is loaded together with the nuclear proteins and vice versa a nuclear mock sample (NE) in included in the cytoplasmic blot. (D) 5-fluorouracil and Nutlin-3a induced expression of 5 selected DEGs alone or in combination with TNF⍺. Results were obtained and are plotted as in A. (E), (F) The relative expression of the 5 selected genes shown in panel C was tested in doxorubicin treated matched cell lines differing for p53 status (MCF7 vector and shp53, D; HCT116 p53+/+ and p53−/−, E).
