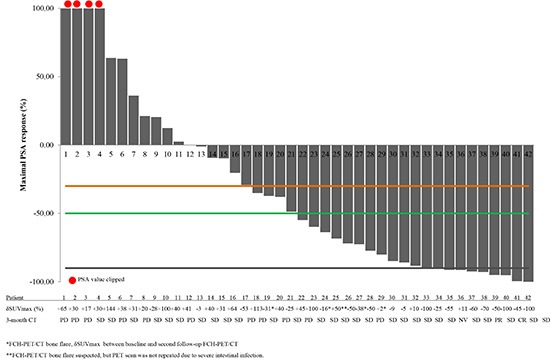
Figure 4. Changes in PSA levels and correlation with either follow-up FCH-PET/CT and CT scan in 42 castration-resistant prostate cancer patients treated with abiraterone with assessable follow-up FCH-PET/CT.

Waterfall plots of maximal PSA change. Reference lines: black, −90%; orange, −50%; green, −30%. Mean change in maximum standardized uptake value (δSUVmax). The table shows the mδSUVmax and 3-months CT response of corresponding patients. Patients with FCH-PET/CT bone flare are marked with an asterisk (*); in these cases δSUVmax is calculated between baseline and second follow-up FCH-PET/CT. A case of suspected FCH-PET/CT bone flare is marked with two asterisks (**); in this case PET scan was not repeated due to severe intestinal infection with clinical deterioration. CT scan response (RECIST criteria).
