
Figure 4. AGK contributes to the progression of HCC in vivo.
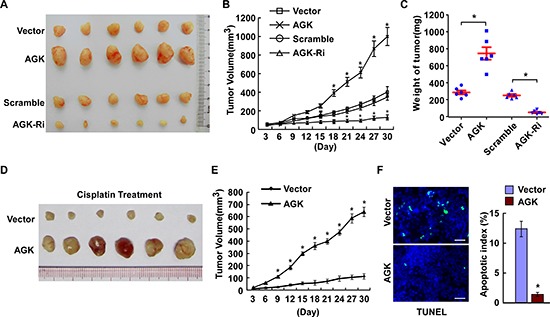
(A) Representative images of tumors from all of the mice in each group. (B) Tumor volumes were measured on the indicated days. (C) Mean tumor weights for each group. (D-F) Xenograft tumors from the mice treated with cisplatin. (D) Images of the tumors from all mice in each group. (E) Tumor volumes were measured on the indicated days. (F) Apoptotic index, determined by the percentage of TUNEL-positive cells. Scale bars: 50 μm. Each bar represents the mean ± SD of three independent experiments; *P < 0.05.