
Figure 1. Bortezomib-resistant myeloma cells.
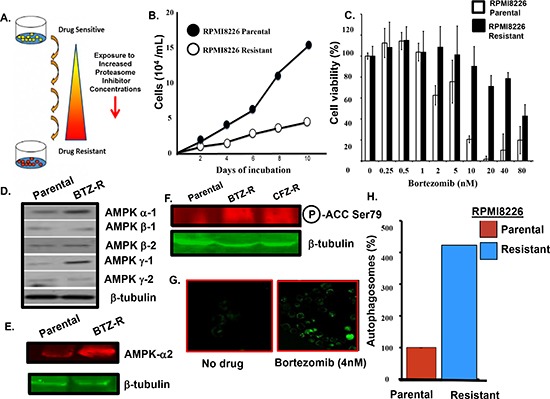
(A) Scheme used to generate bortezomib-resistant cells. (B) Growth rate comparison of parental and drug-resistant cells as measured by trypan blue staining. (C) Viability of parental and bortezomib-resistant cells after bortezomib addition at the indicated concentrations. Viability was determined using the XTT assay and the values represent the arithmetic mean of triplicate measurements and error bars represent the standard deviation. (D) Western blot to compare the level of individual AMPK subunits in the parental and bortezomib-resistant cells. Lysates from parental or resistant cells were probed using antibodies to the AMPK alpha 1/2, beta 1/2 and gamma 1/2 subunits. (E) Western blotting to compare the level of AMPK alpha-2 subunit in parental and bortezomib-resistant cells. (F) Western blotting to compare the level of phospho-Ser79 ACC in parental and drug-resistant myeloma cells. (G) Confocal microscopy to detect autophagosomes. Cells treated with bortezomib, pelleted, incubated with the cyto-ID green detection reagent, applied to a microscope slide and visualized using a Zeiss LSM170 confocal microscope. (H) Quantitation of autophagosomes in parental and drug-resistant cells. Cells were incubated with the cyto-ID detection reagent and autophagosomes quantitated by flow cytometry. Shown is the result of triplicate measurements.