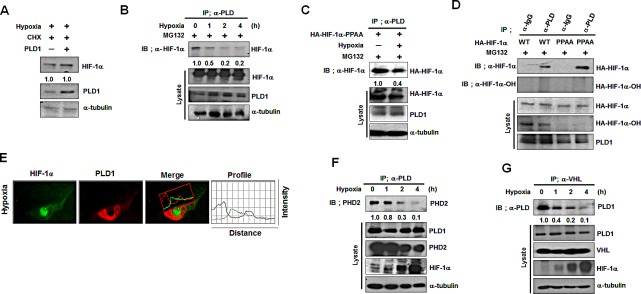
Figure 5. The protein interactions of PLD1 with HIF-1α, PHD2 and VHL are abolished under hypoxia.

(A) Effect of PLD1 on the stability of HIF-1α under hypoxia. Lysates were analyzed by immune blot. The band intensity was quantified and the levels of HIF-1α to α-tubulin were normalized. Data are representative of three independent experiments. (B) IP assay for the interaction of PLD1 with HIF-1α under hypoxic conditions. The band intensity was quantified. Data are representative of three independent experiments. (C) IP assay was performed to test the effects of hypoxia on the interaction of PLD1 with HA-HIF-1α-PPAA in the presence of MG132. The band intensity was quantified. Data are representative of three independent experiments. (D) IP assay of lysates prepared from HEK293 cells that were cotransfected with HA-HIF-1α (wild type or PPAA mutant) and PLD1 in the presence of MG132. The band intensity was quantified. Data are representative of three independent experiments. (E) HEK293 cells were incubated under hypoxic conditions, after which colocalization between HIF-1α and PLD1 was analyzed. Representative fluorescence microphotographs are shown together with the profiles of colocalization. Data are representative of three independent experiments. (F) Effect of hypoxia on the interaction of PLD1 with PHD2. The band intensity was quantified. Data are representative of three independent experiments. (G) Effect of hypoxia on the interaction of VHLwith PLD1. The band intensity was quantified. Data are representative of three independent experiments.
