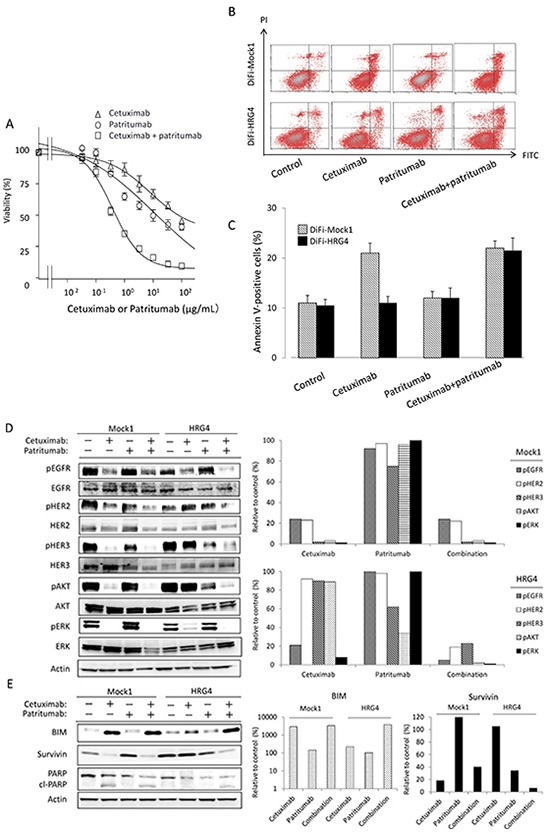
Figure 3. Effect of patritumab on heregulin-mediated cetuximab resistance in DiFi-HRG cells in vitro.

(A) DiFi-HRG4 cells were incubated for 5 days with cetuximab alone, patritumab alone, or the combination of both drugs at the indicated concentrations, after which cell viability was assessed. Data are means ± SE from three independent experiments. (B, C) DiFi-Mock1 or DiFi-HRG4 cells were cultured overnight in medium containing 10% serum and then incubated for 48 h in the absence or presence of cetuximab alone (10 μg/mL), patritumab alone (10 μg/mL), or the combination of both drugs in serum-free medium, after which the number of apoptotic cells was determined by staining with propidium iodide (PI) and fluorescein isothiocyanate (FITC)–labeled annexin V followed by flow cytometry. Representative flow cytometric profiles are shown in (B), and quantitative data (means ± SE of three independent experiments) are shown in (C). (D, E) DiFi-Mock1 or DiFi-HRG4 cells were cultured overnight in medium containing 10% serum and then incubated for 6 h (D) or 48 h (E) in the absence or presence of cetuximab alone (10 μg/mL), patritumab alone (10 μg/mL), or the combination of both drugs in serum-free medium, after which cell lysates were prepared and subjected to immunoblot analysis with antibodies to the indicated proteins (left panels). The intensity of the bands corresponding to phosphorylated forms of EGFR, HER2, HER3, AKT, and ERK (D) or to BIM and survivin (E) was normalized by that of the corresponding total proteins or β-actin, respectively, and then expressed relative to the corresponding value for control cells not exposed to drug (right panels).
