
Figure 3. The miR-520d-5p downregulation of TWIST1 leads to decreased miR-10b expression.
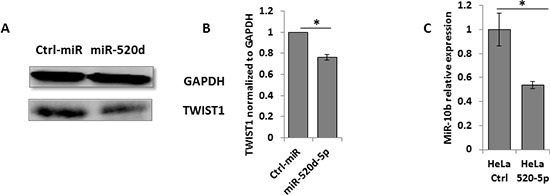
(A) Western blot for TWIST1 expression (bottom plots) in HeLa cells over expressing a control miRNA (left) or miR-520d-5p (right). GAPDH was used as loading control (top plots). Quantification of normalized data (B) *P < 0.03 results are representative of two independent experiments. (C) Levels of miR-10b quantified by qRT-PCR in cells overexpressing miR-520d-5p or control miR (normalized to U6). Results are representative of two independent experiments. *P < 0.03.