
Figure 5. miR-520d-5p affects the levels of E-Cadherin.
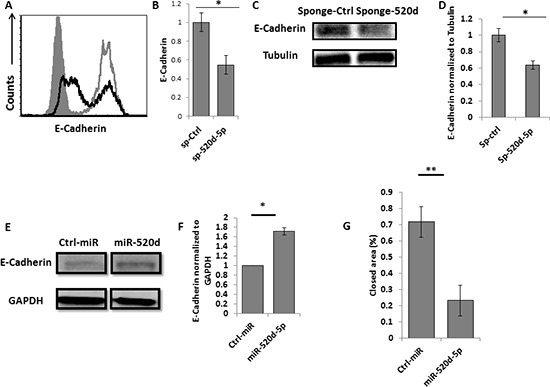
(A) Intracellular staining for E-Cadherin in JEG 3 cells transduced with a control sponge (grey empty lines) or with anti-miR-520d-5p sponge (black empty histograms) (B) quantification of the E-Cadherin downregulation presented in (A), *P < 0.03 error bars derived from standard deviation, results representative of two independent experiments. (C) Western blot for E-Cadherin (top) and Tubulin (control ) bottom plots expression in JEG 3 cells transduced with a control sponge or with anti-miR-520d-5p sponge (D) Quantification of the E-Cadherin downregulation presented in (C), (E) Western blot for E-Cadherin (top) expression in HeLa cells expressing control miRNA (left) or miR-520d-5p (right). GAPDH was used as loading control (bottom), (F) Quantification of the data presented in (E). *P < 0.03 (G) HeLa cells overexpressing either control miR or miR-520d-5p were subjected to wound healing assay with images taken at 0 and 16 hours after incubation. The rate of migration was determined by quantifying the total distance that the cells moved from the edge of the scratch toward the center of the scratch. Quantification of the closed area normalized to initial wound distance. *P < 0.02, **P < 0.001. The data represents two independent experiments.