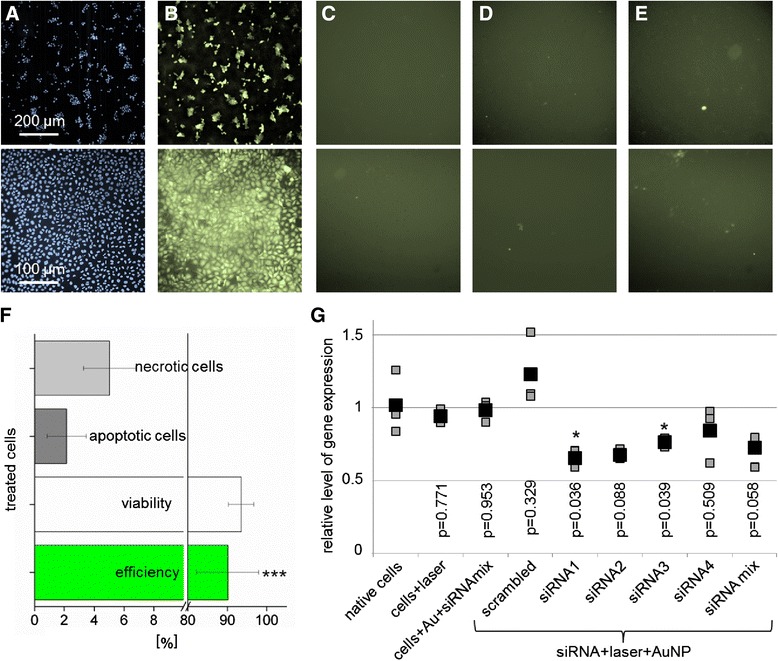
Figure 4.

siRNA transfection. A-E) Microscopic images of treated cells (upper row CT1258 cells, bottom row ZMTH3 cells): A) The fluorescent images of Hoechst stained cell nuclei shows cell density. B) An Alexa fluor 488 labeled siRNA was efficiently transfected into the cells. C) The incubation of cells with siRNA (negative control) and D) the fluorescent image of AuNP labeled cells (AuNP control) show no siRNA uptake. E) A slight fluorescence signal in the laser control is detected when native cells are irradiated with the laser in the presence of the fluorescent siRNA. F) The flow cytometric analysis of siRNA transfected cells shows an efficiency of about 90% and a cell viability of 93%. Every data point represents the mean value ± standard error of n = 3 independent experiments in triplicates on different days. G) Real-time PCR analysis: Transfection of CT1258 cells results in HMGA2 gene knock down using different HMGA2 specific siRNAs (real-time PCR analyses were performed in triplicates). The black boxes represent the mean values of the qRT-PCR analysis and the grey boxes depict each of the three single measurements.
