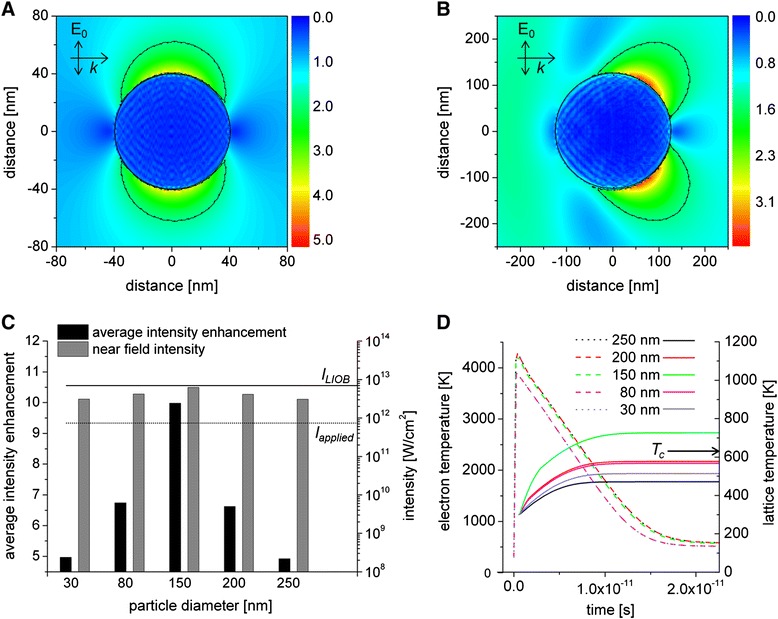
Figure 5.

Particle – laser interaction. Particle excitation after interaction of a 798 nm laser pulse with duration of 120 fs and a radiant exposure of 80 mJ/cm2 (I = 6.26×10¹¹ W/cm2). A) Map of the near field enhancement factor (η = E/E0) around an 80 nm particle and B) 250 nm particle. The dashed lines indicate the areas were the enhancement factor is higher than 1/e. The incident field Eo propagates along the x axis. C) Calculations of the near field enhancement around AuNP (left y axis) and the near field intensity (right y axis) for different AuNP sizes. Additionally the threshold for the applied intensity (dashed line) and the calculated intensity for LIOB using a NA 1.3 focused laser spot (solid line) is drawn. D) Evolution of the electron- (dashed lines) and lattice temperature (solid lines) after laser pulse absorption. The critical temperature Tc when water becomes hydro-dynamically unstable is indicated at 647 K.
