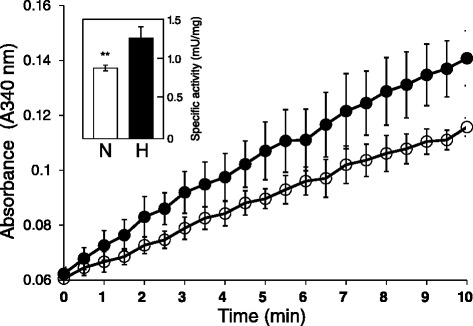
Figure 2.

In vitro activities of DBT enzyme in normoxic and hypoxic mouse kidneys. Plots show time-dependent changes in absorbance at 340 nm. The histograms in the insets show the slopes (rate) of the changes in the linear portion of the curves. The y-axes in the histograms indicate the specific activity expressed as mU/mg mitochondrial protein. 1 mU is defined as the amount of enzyme needed to reduce 1 nmol of NAD+ per min at 37°C. Assays were carried out with the mitochondrial fraction of homogenized tissue extract, and the reactions were run using sodium α-ketoisocaproate as the substrate. Data are expressed as mean values ± standard deviation (**p < 0.05). Open circles and histogram, normoxia; closed circles and histogram, hypoxia.
