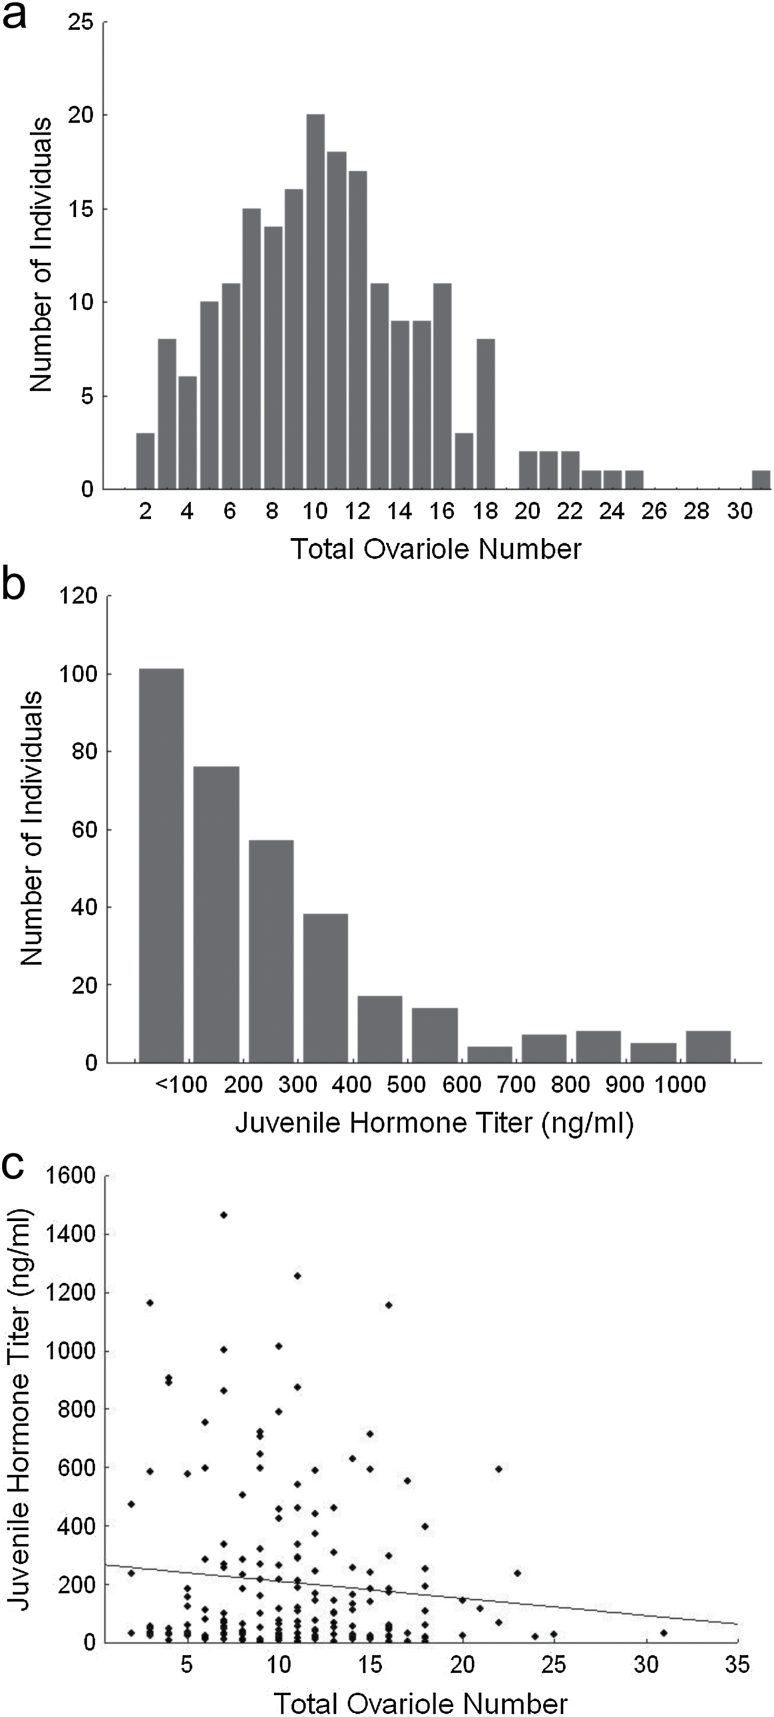
Figure 1.
Phenotype distributions and correlation. (a) Ovary size distribution. Ovary size for each individual is measured as the sum of total ovarioles from the left and right ovary for each individual worker from the approximately 700 workers assayed. Mean ovary size was 10.89 ± SD. 5.078. (b) Juvenile hormone titer distribution. Juvenile hormone titer as measured for individual workers from the overall mapping population. Bars represent bins of individuals with titers greater or equal to the lower bound. Mean juvenile hormone titer was 257.9±253.3ng/ml. (c) Total ovary size and juvenile hormone titer after Vg knockdown were not correlated in our sample (r = −0.103, P = 0.161).

