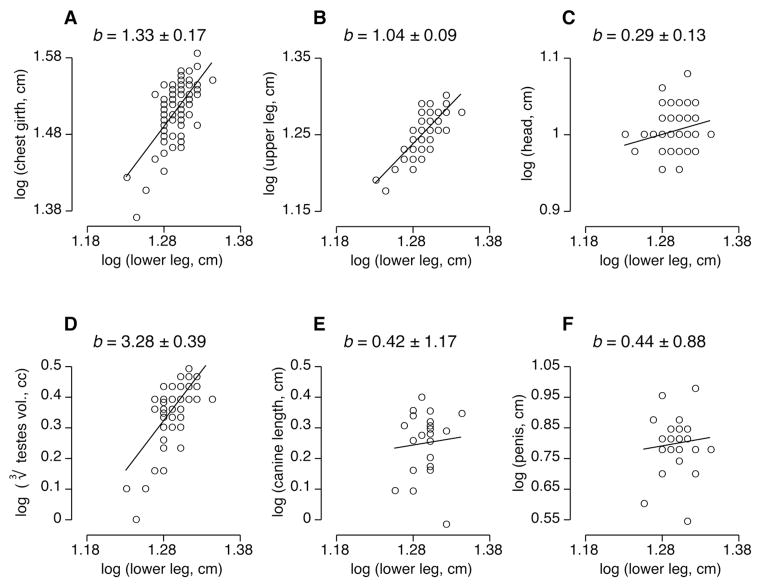
Figure 2.
Examples of allometric (log10-log10) plots, showing how different structures scale relative to the length of lower leg (our estimate of body size) in vervet monkeys. All x-axes span two log units; y-axes span two (A–C) or five log units (D–E). (A) Chest girth shows weak positive allometry (b > 1). (B) The length of the upper leg shows near perfect isometry (b = 1). (C) The head shows negative allometry (b < 1). Allometric slopes (b) given ± 1 SE. Data from the St. Kitts and Nevis site for males of all adult ages for illustrative purposes.

